
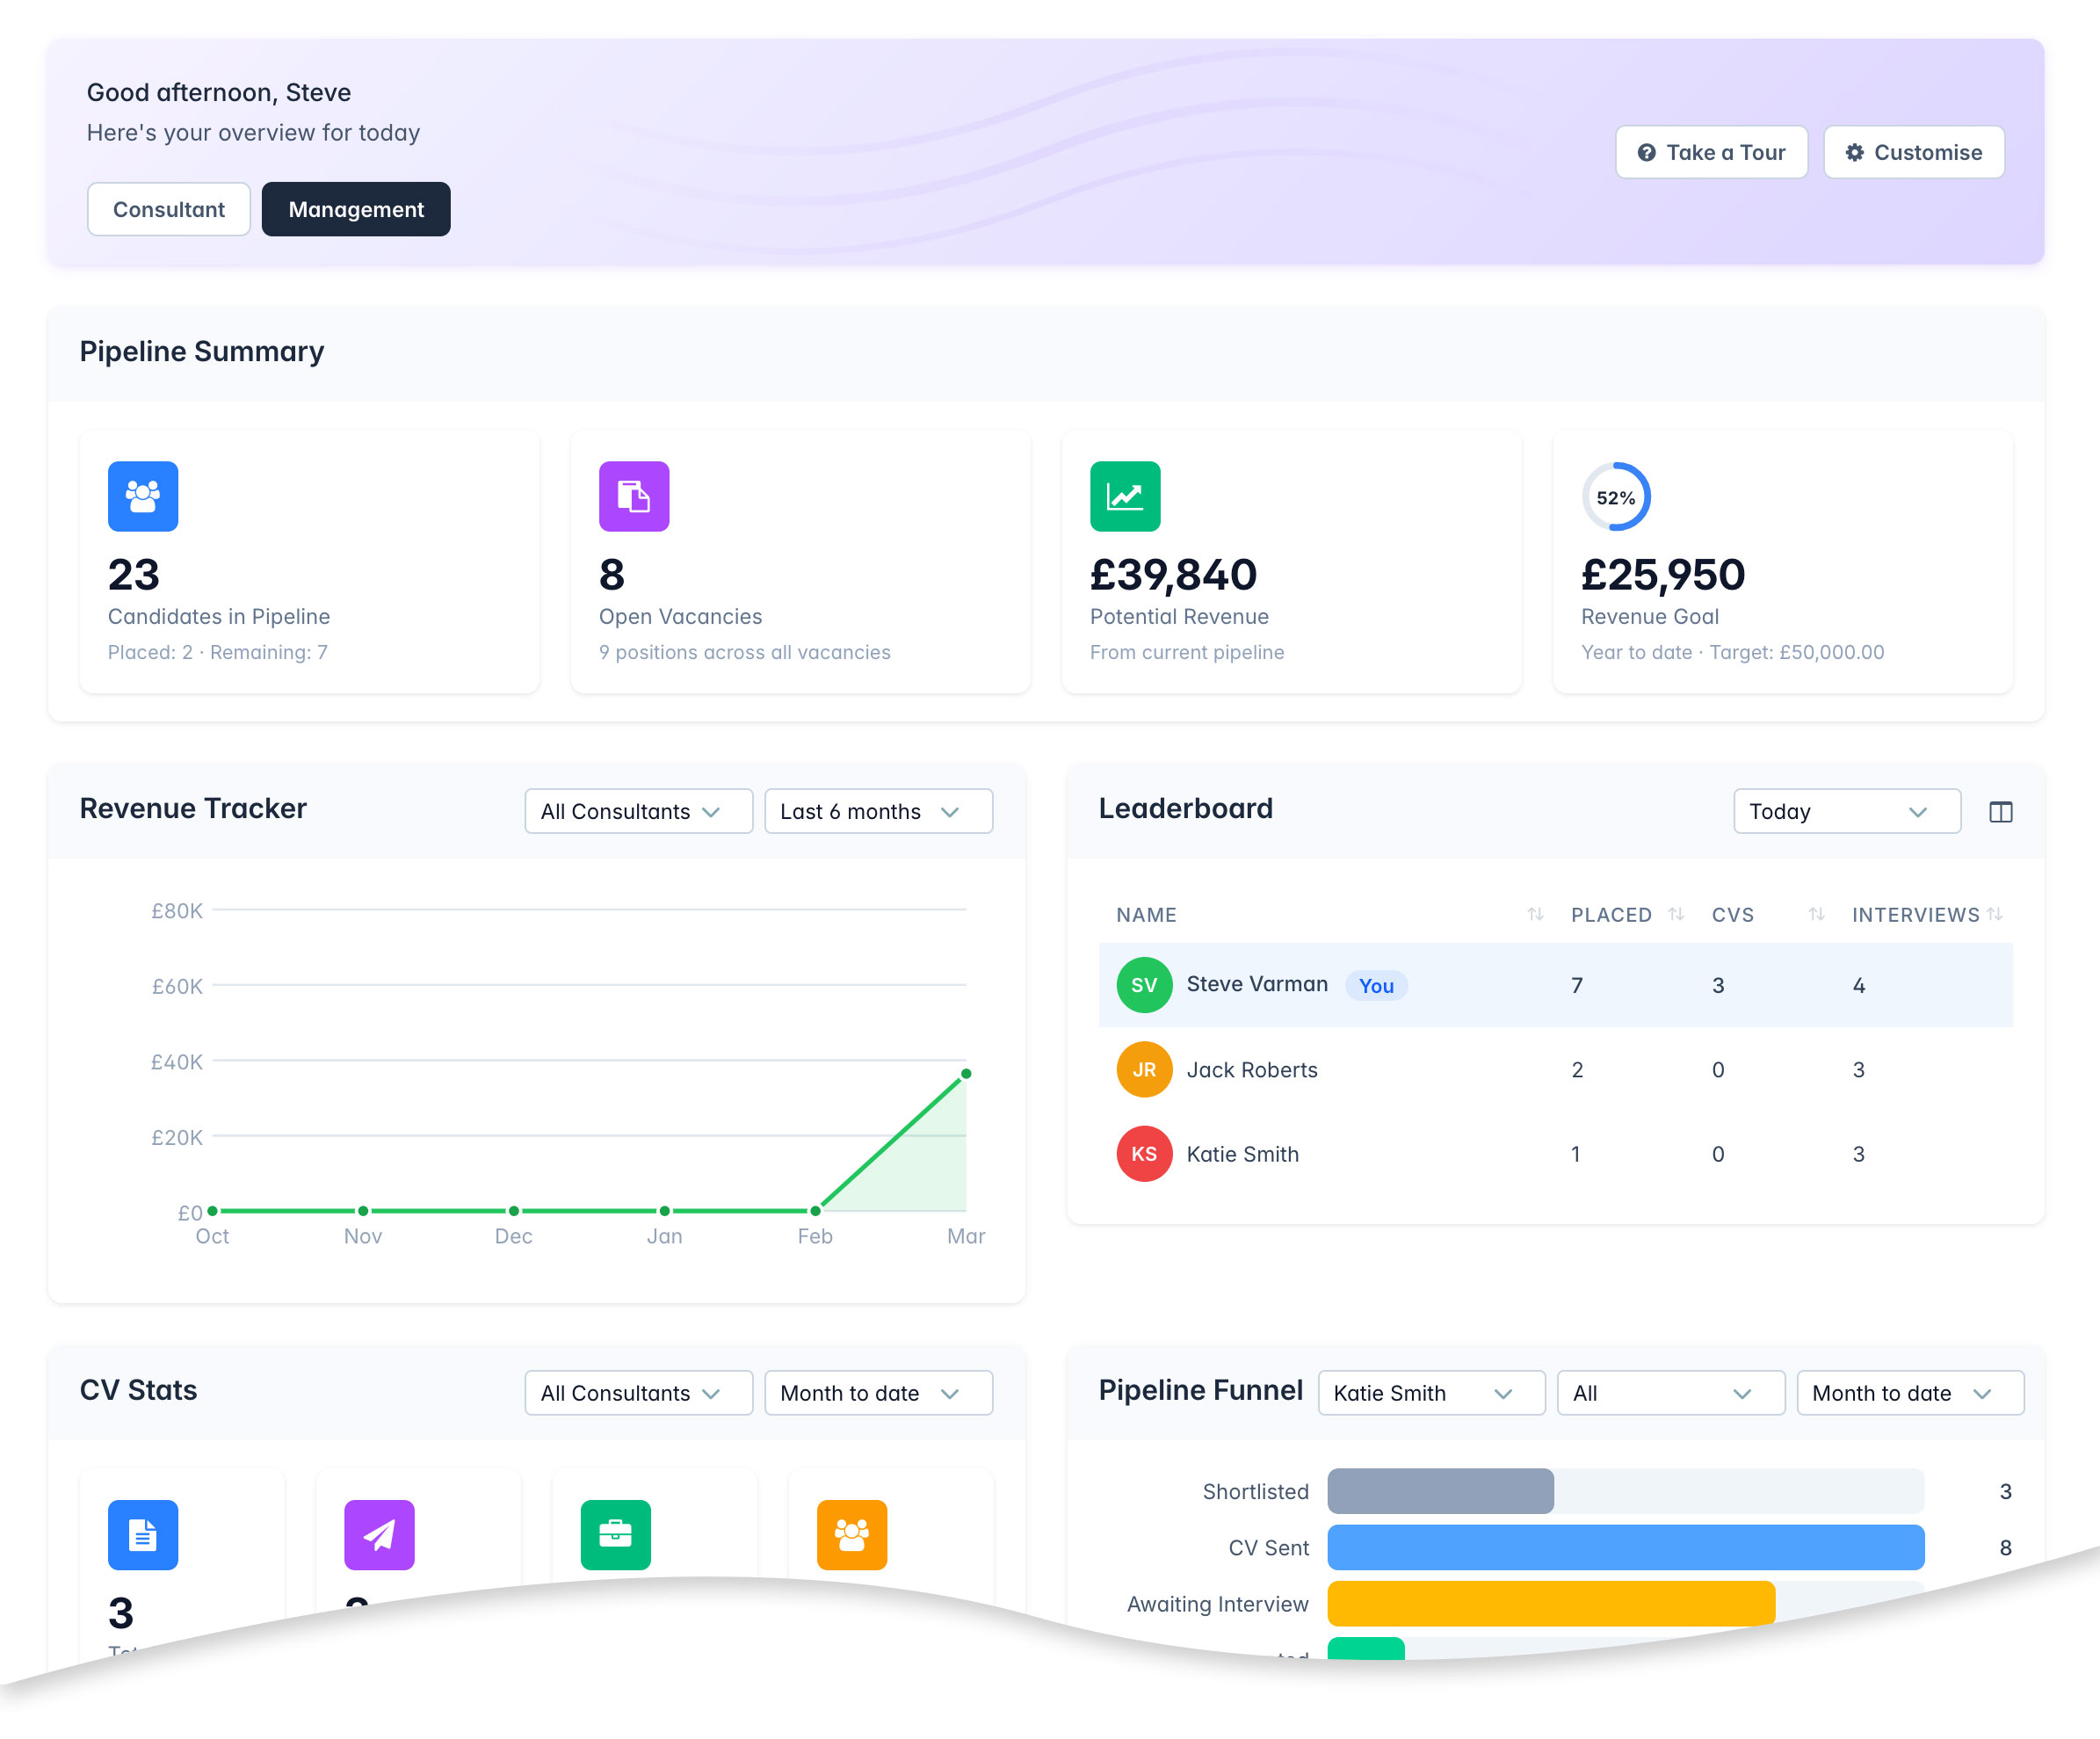
The dashboard gives you an at-a-glance overview of your recruitment activity. It is split into two tabs: Consultant (available to all users) and Management (available to system administrators only).
You can customise which widgets are shown, their order, and their size by clicking the Customise button in the top-right corner of the dashboard.
Click to learn more…
Customising Your Dashboard
Click the Customise button in the top-right corner to open the configuration panel. From here you can:
- Enable or disable widgets — tick or untick the checkbox next to each widget to show or hide it.
- Reorder widgets — drag and drop widgets to rearrange their position on the dashboard.
- Resize widgets — drag a widget between the half-width and full-width columns to change its size.
Some widgets may be marked as Mandatory or Disabled by a system administrator. Mandatory widgets are always shown and cannot be turned off. Disabled widgets are hidden and cannot be turned on.
Column Configuration
Some table widgets (Priority Vacancies, Upcoming Interviews, My Tasks, Leaderboard) allow you to choose which columns are displayed. Click the column toggle icon on the widget header to select your preferred columns.
Filters
Many widgets include filter dropdowns in their header. Common filters include:
- Consultant/Team — narrow data to a specific consultant or team (management tab only).
- Period — change the date range (e.g. Today, Last 7 Days, Month to Date, Year to Date).
- View — switch between personal and team-wide data.
- Credit — for placements, choose whether to see placements by vacancy consultant, candidate consultant, or both.
Your filter selections and widget configuration are saved automatically and will be remembered the next time you visit the dashboard.
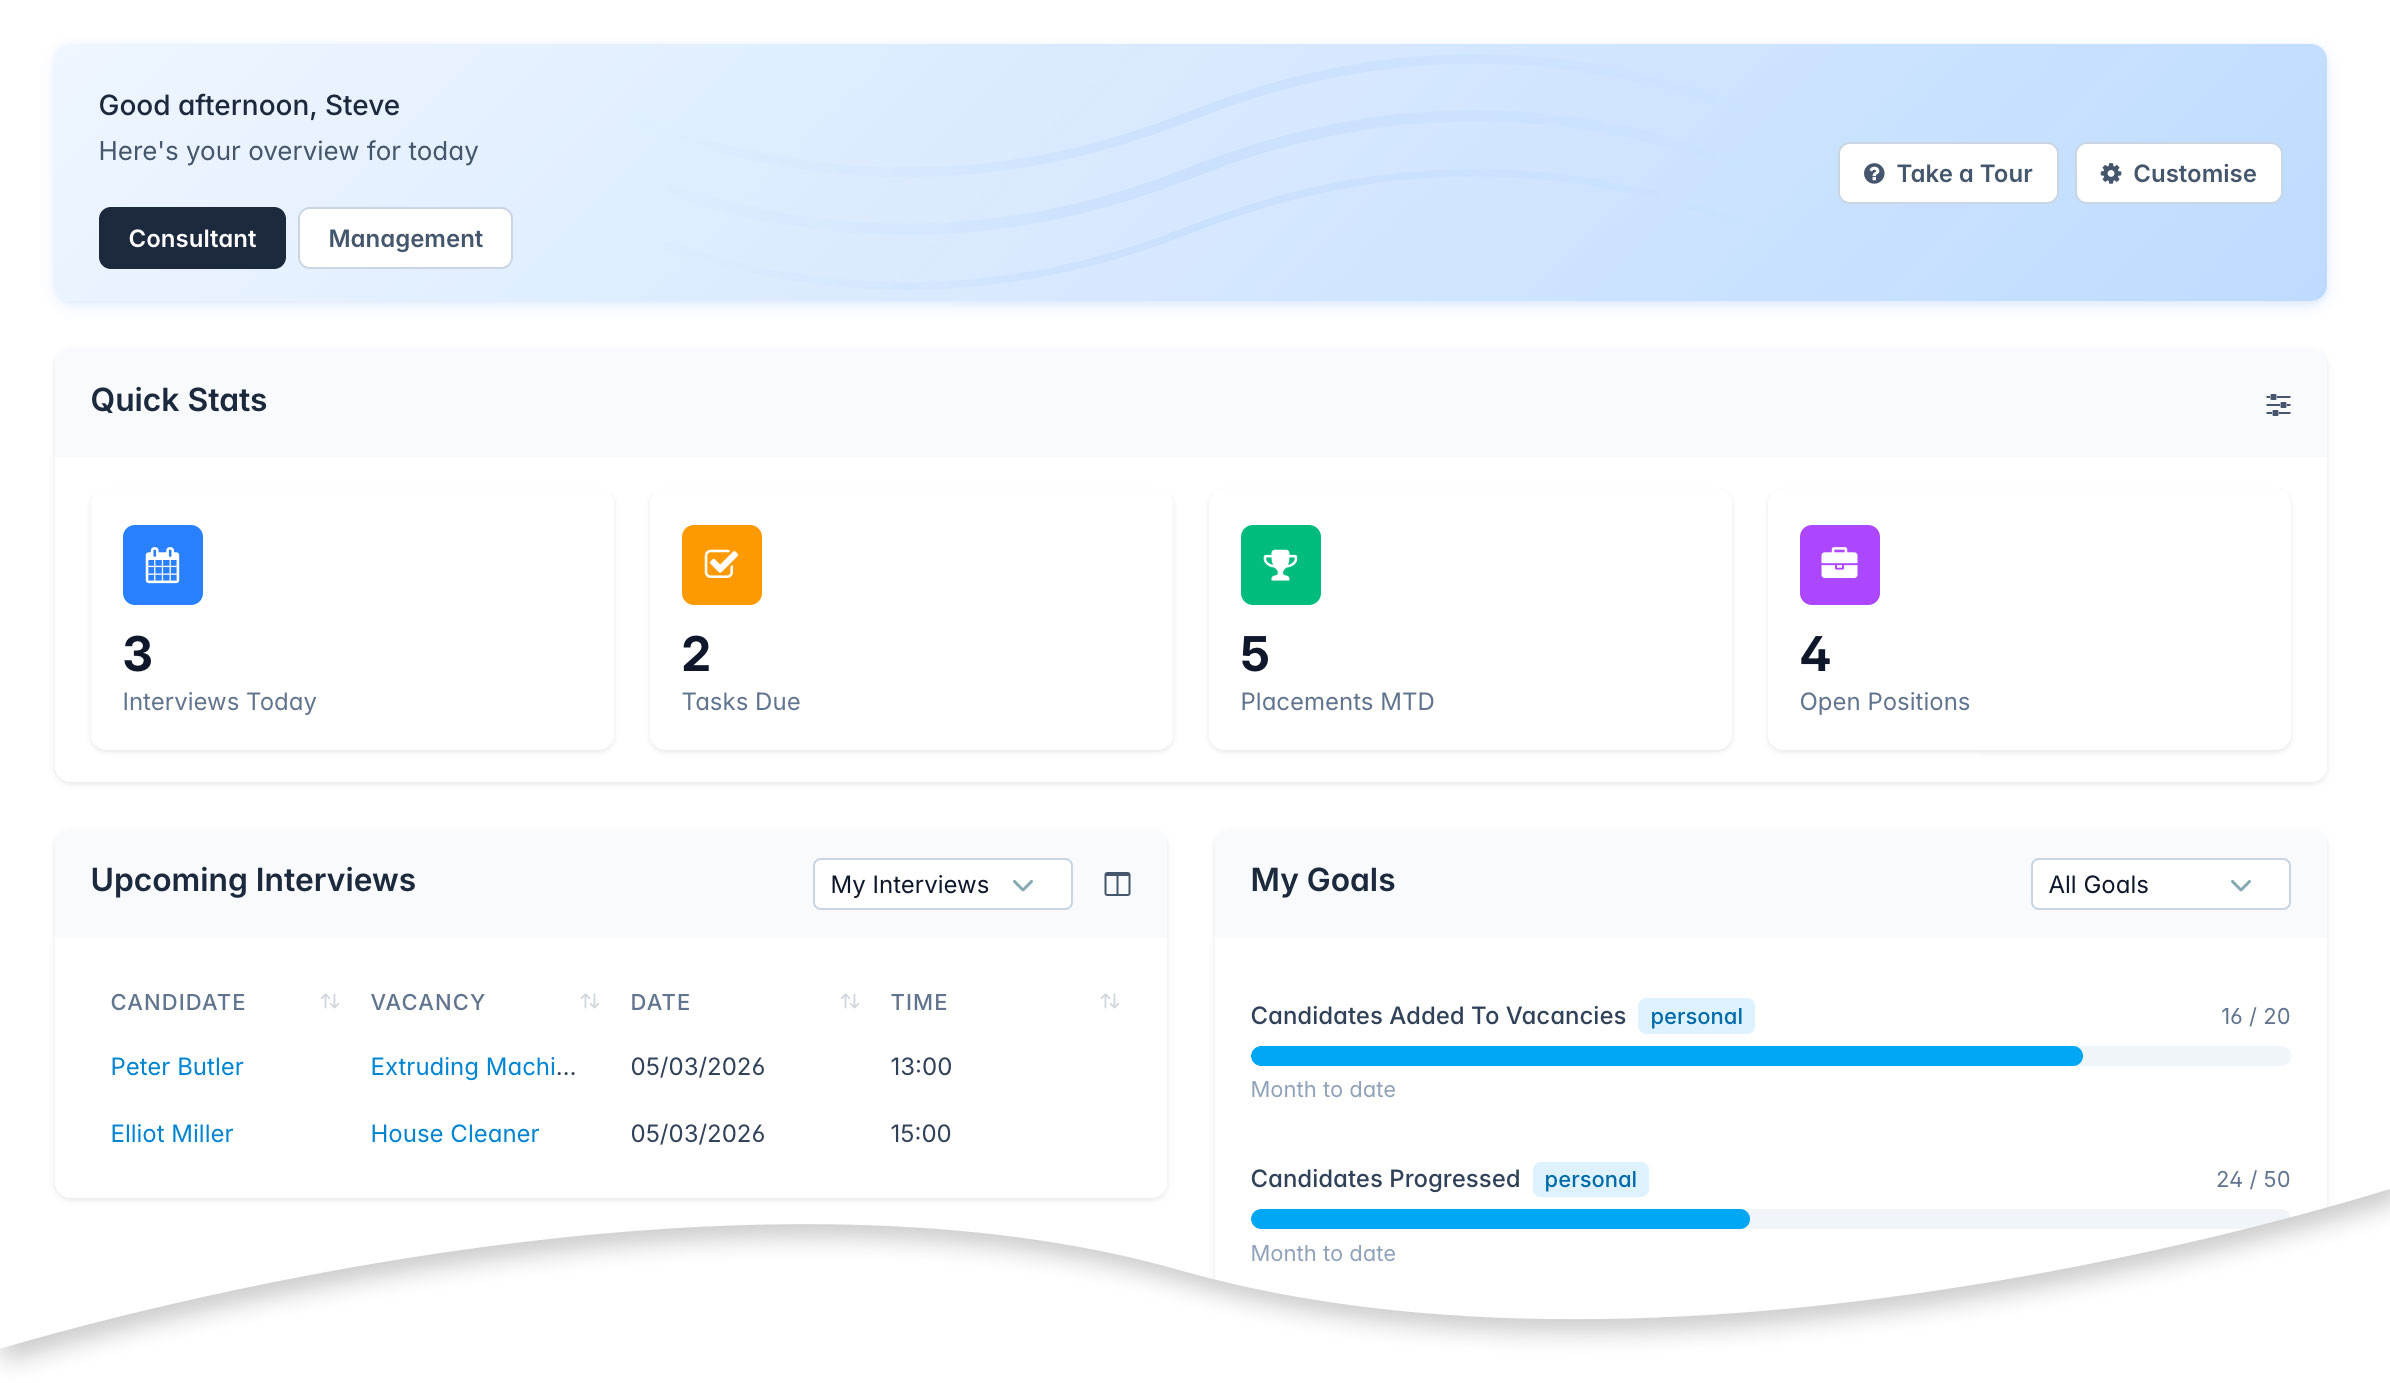
Consultant Tab
Click to learn more…
The consultant tab is your personal workspace. All data on this tab is scoped to your own activity unless stated otherwise.
Consultant view widgets
Quick Stats
Click to learn more…
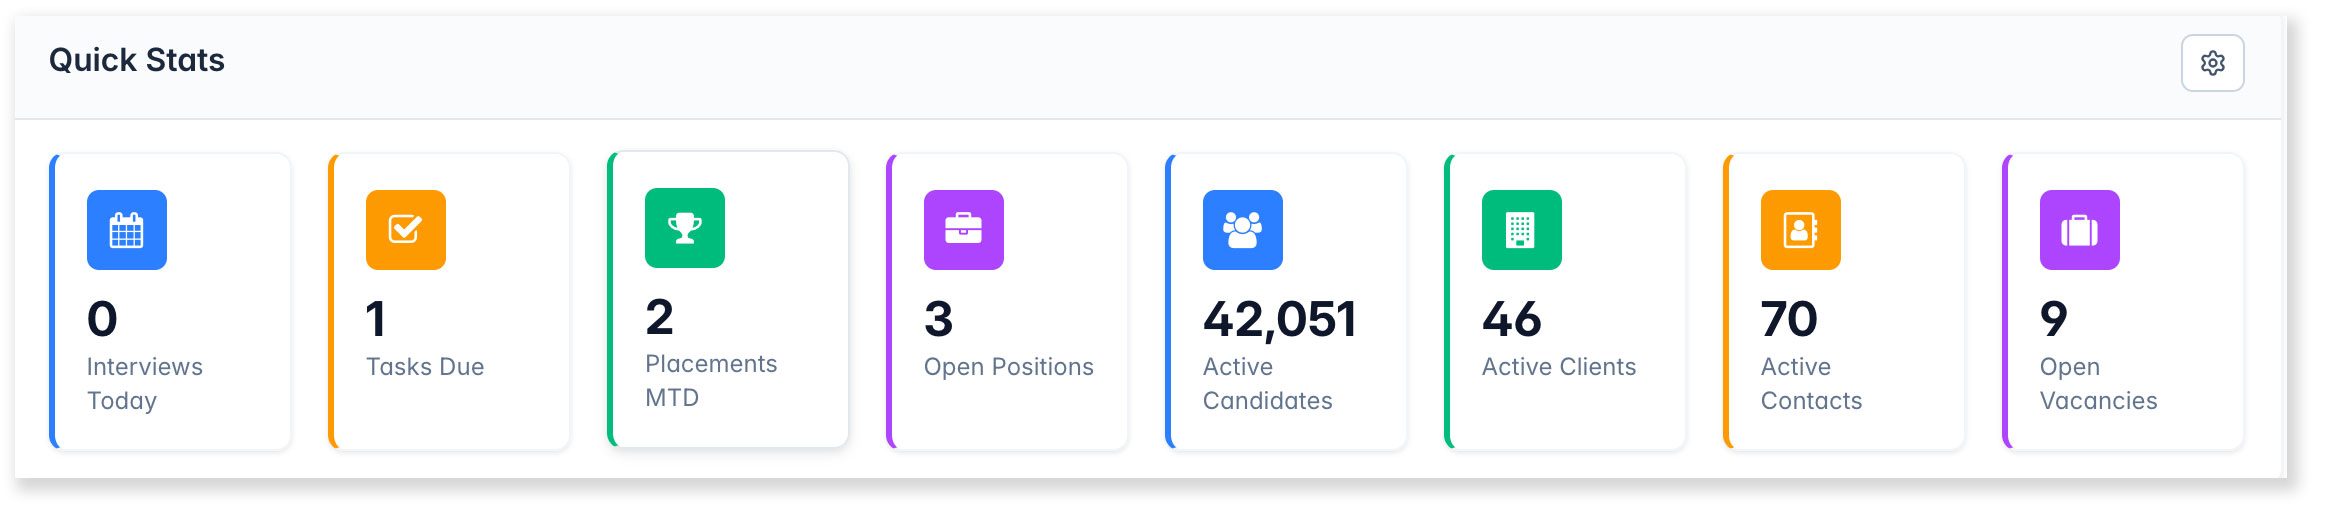
A row of summary tiles showing key numbers at a glance
Includes: Interviews booked today, tasks that are due, placements made (month to date), how many active candidates, clients, contacts and open vacancies. Choose which to diusplay from the Settings menu.
Interviews
Click to learn more…
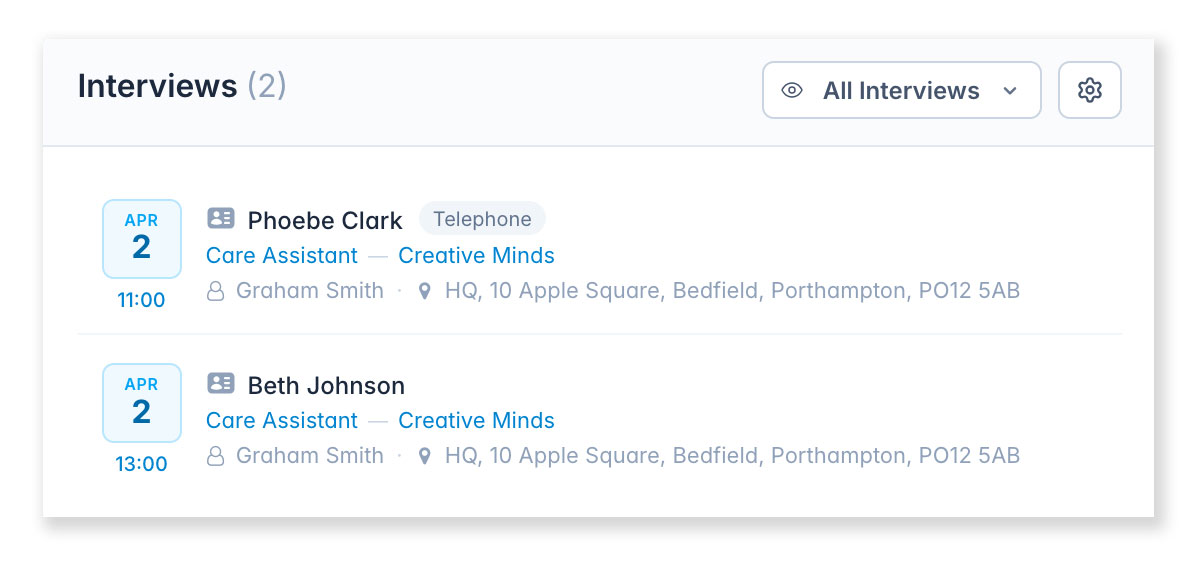
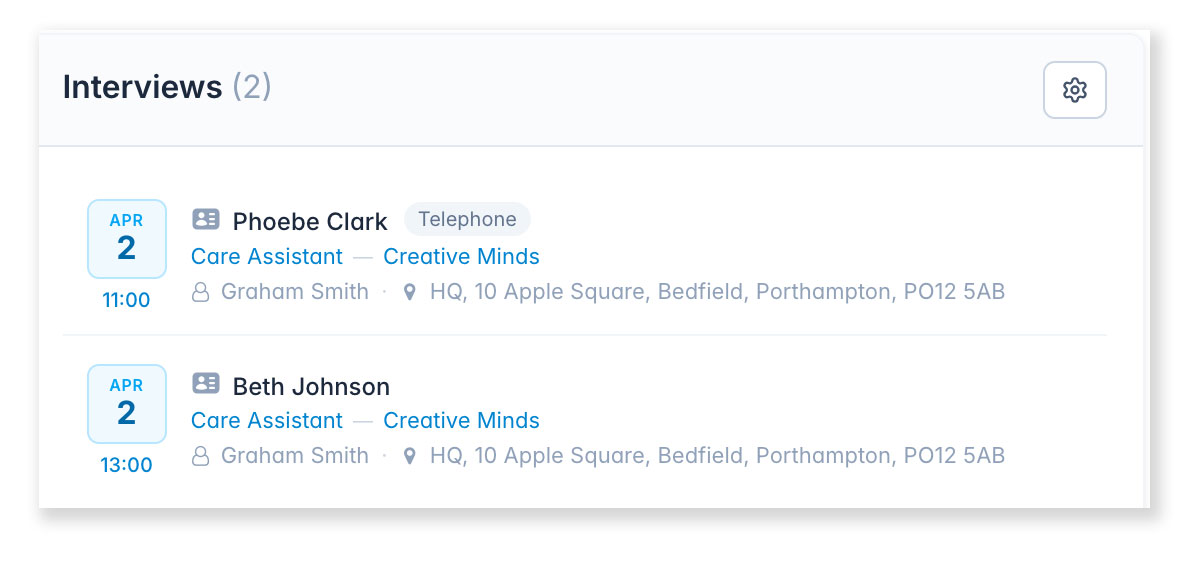
Displays interviews scheduled in the next 14 days
Settings:
- Use the filter to switch between My Interviews and All Interviews.
- Choose what information is displayed.
- Choose if My Interviews is based on the vacancy or candidate owner
My Goals
Click to learn more…
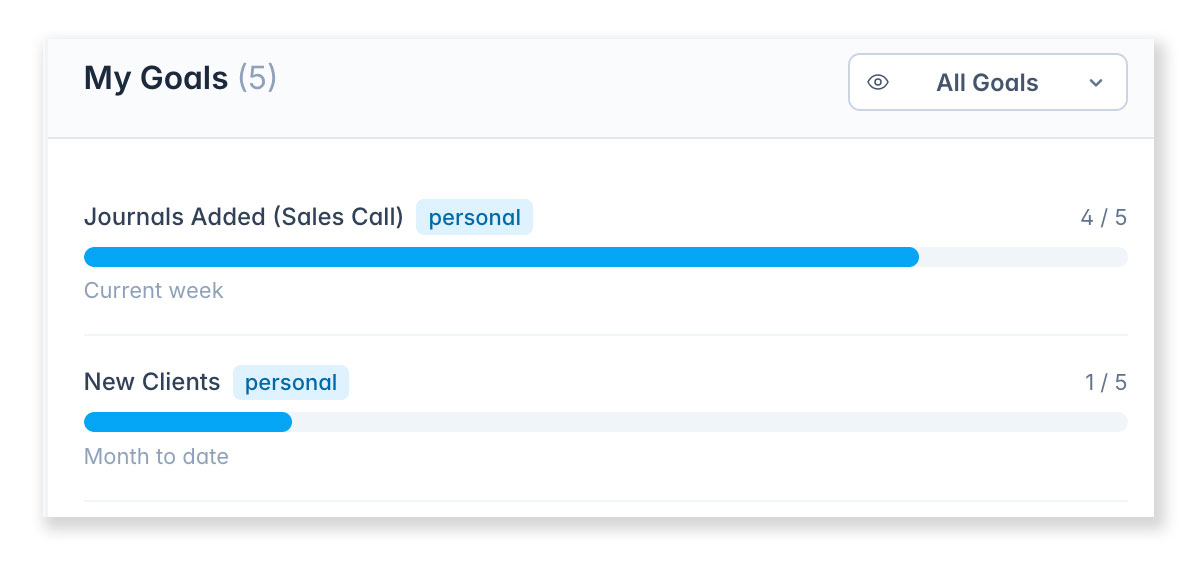
Displays your active goals and current progress towards each target
Goals are set by a system administrator under [Settings > System Settings > Goals]. Progress is calculated automatically based on your activity (e.g. CVs sent, placements made, interviews added) within the goal’s date range.
Goals can be individual or shared between you and other colleagues.
My Tasks
Click to learn more…
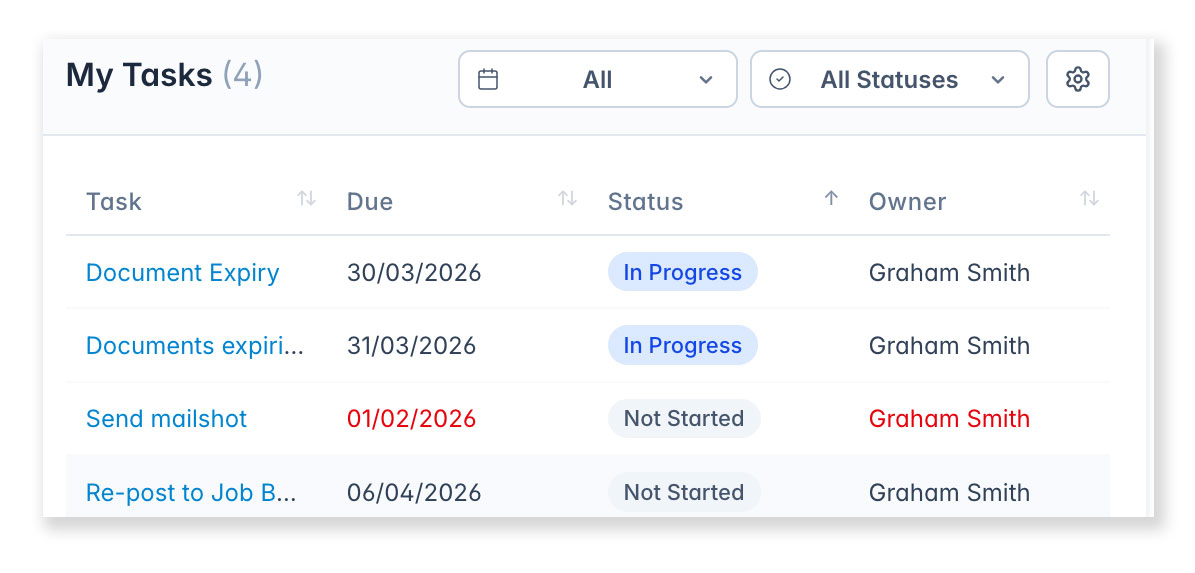
A list of tasks that assigned to you
Each task displays its subject, due date, and current status. You can choose the date range, filter by status, customise the information shown, and control how many tasks appear per page. Click any task to open it.
My Pipeline
Click to learn more…
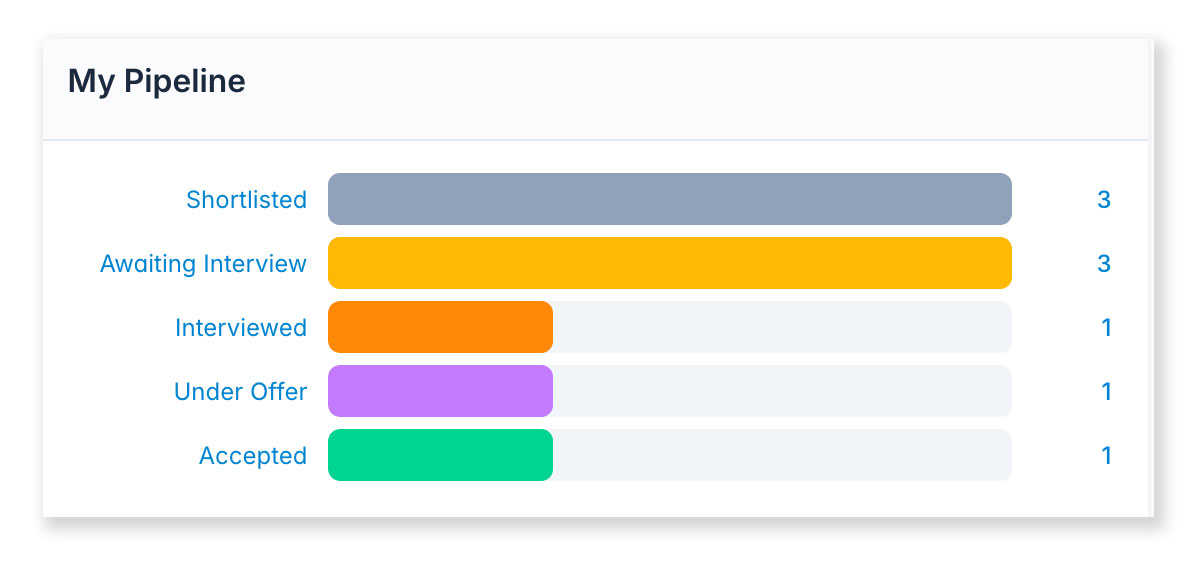
Shows the number of your candidates at each vacancy pipeline stage
Includes candidates where you are the managing consultant, who are on open vacancies and have not yet reached their start date. Click the number to jump to that status in [Dashboard > Pipeline] (Candidates view).
CV Stats
Click to learn more…
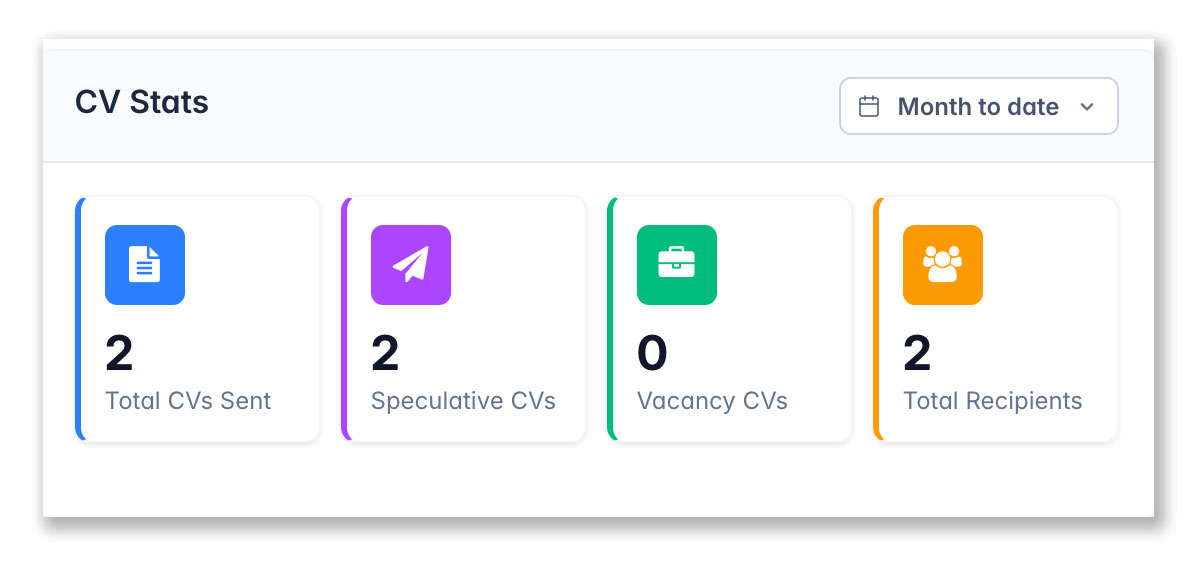
A summary of CVs you have sent
The summary shows total CVs sent, split into speculative and vacancy CVs, along with the number of unique recipients. Use the Period filter to change the date range.
Only CVs attached from a candidate’s record are counted. CVs sent externally (e.g. Outlook or Gmail) are not included.
Vacancy CVs are sent via Send CVs on a vacancy Pipeline screen. All other CVs are counted as speculative.
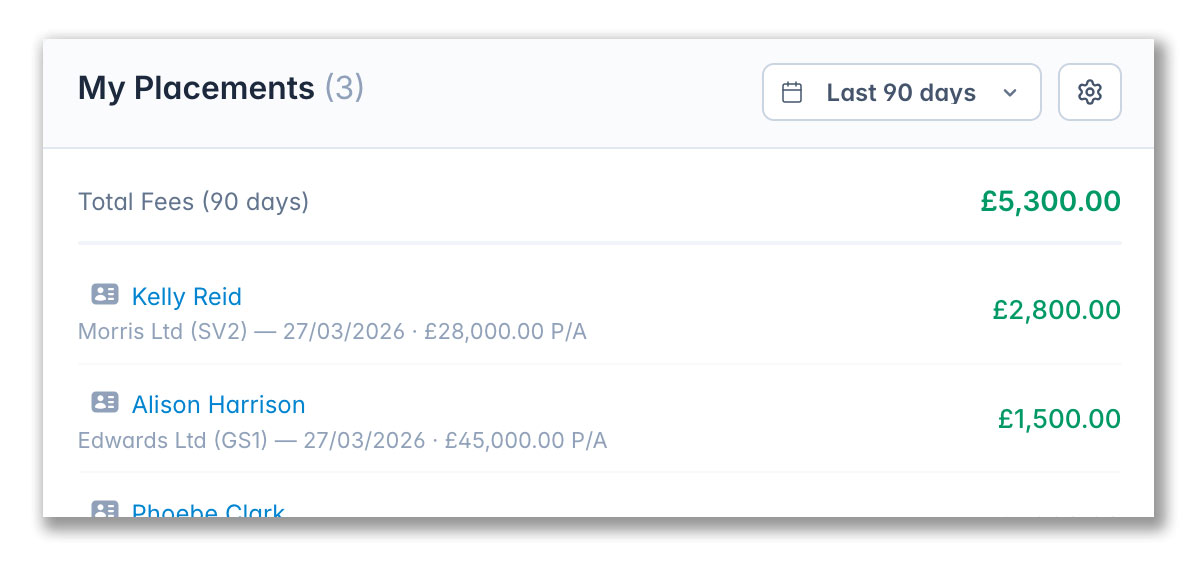
My Placements
Click to learn more…
A table of your placements showing the candidates
Includes vacancy, client, and placement date. Use the Credit filter to switch between placements where you are the vacancy, candidate or client consultant.
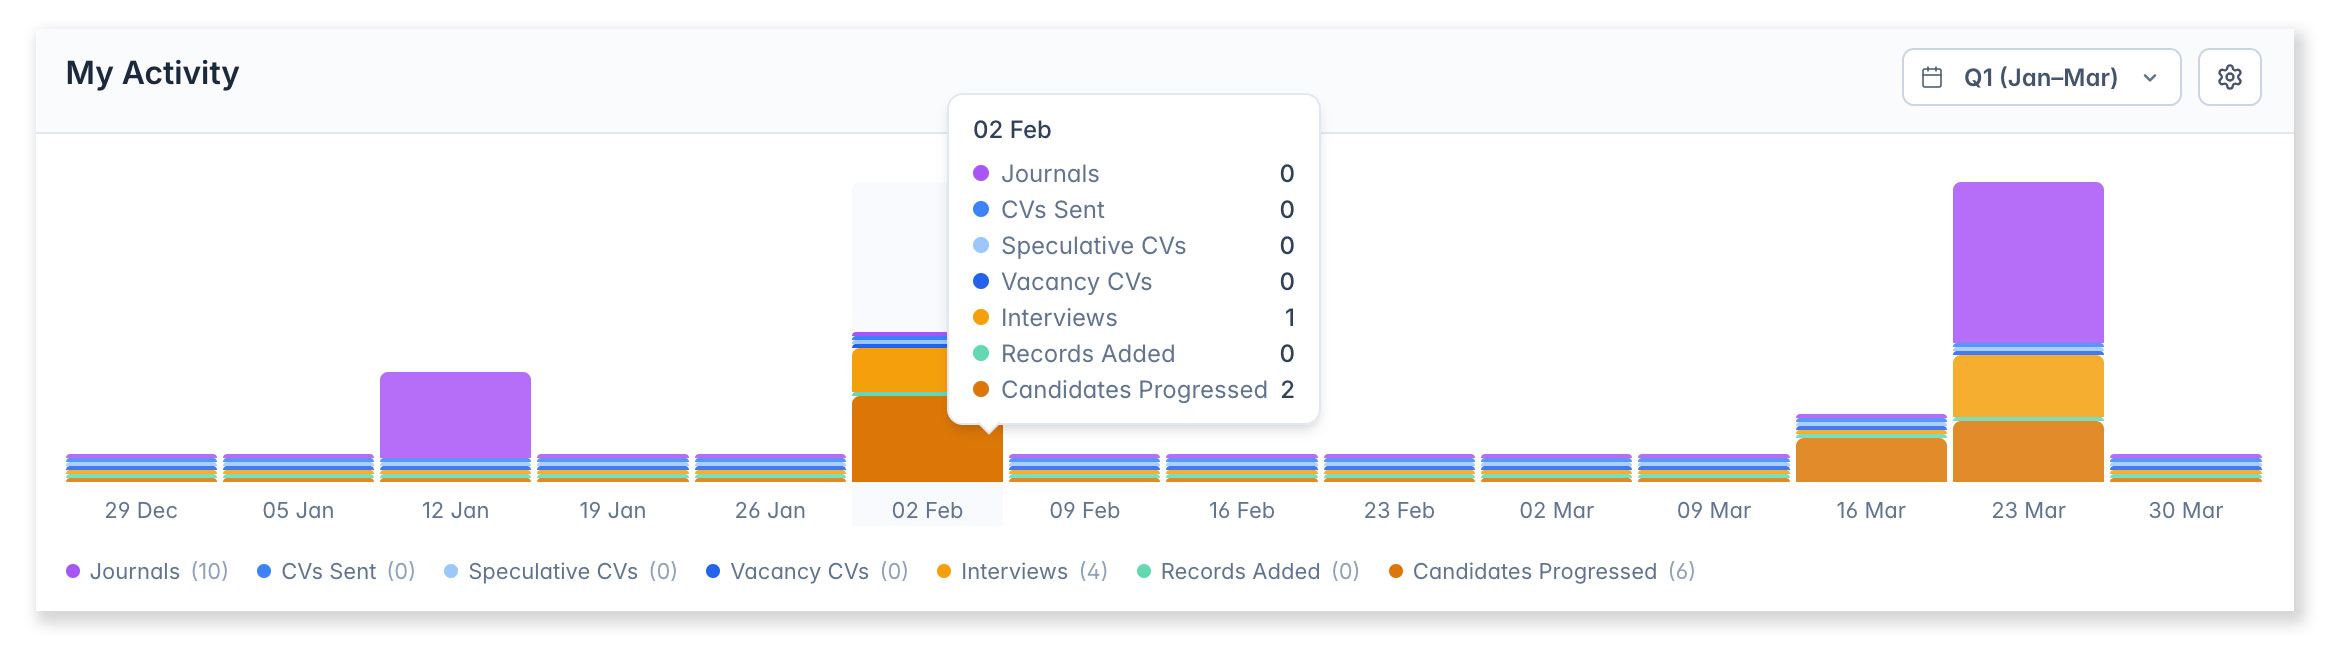
My Activity
Click to learn more…
Shows your activity over time
Tracks journals added, CVs sent (total, speculative, and vacancy), interviews scheduled, records added, and candidates progressed through pipeline. Use the Settings to choose which data to display and time period.
Hover over a column to see numerical values of each activity type.
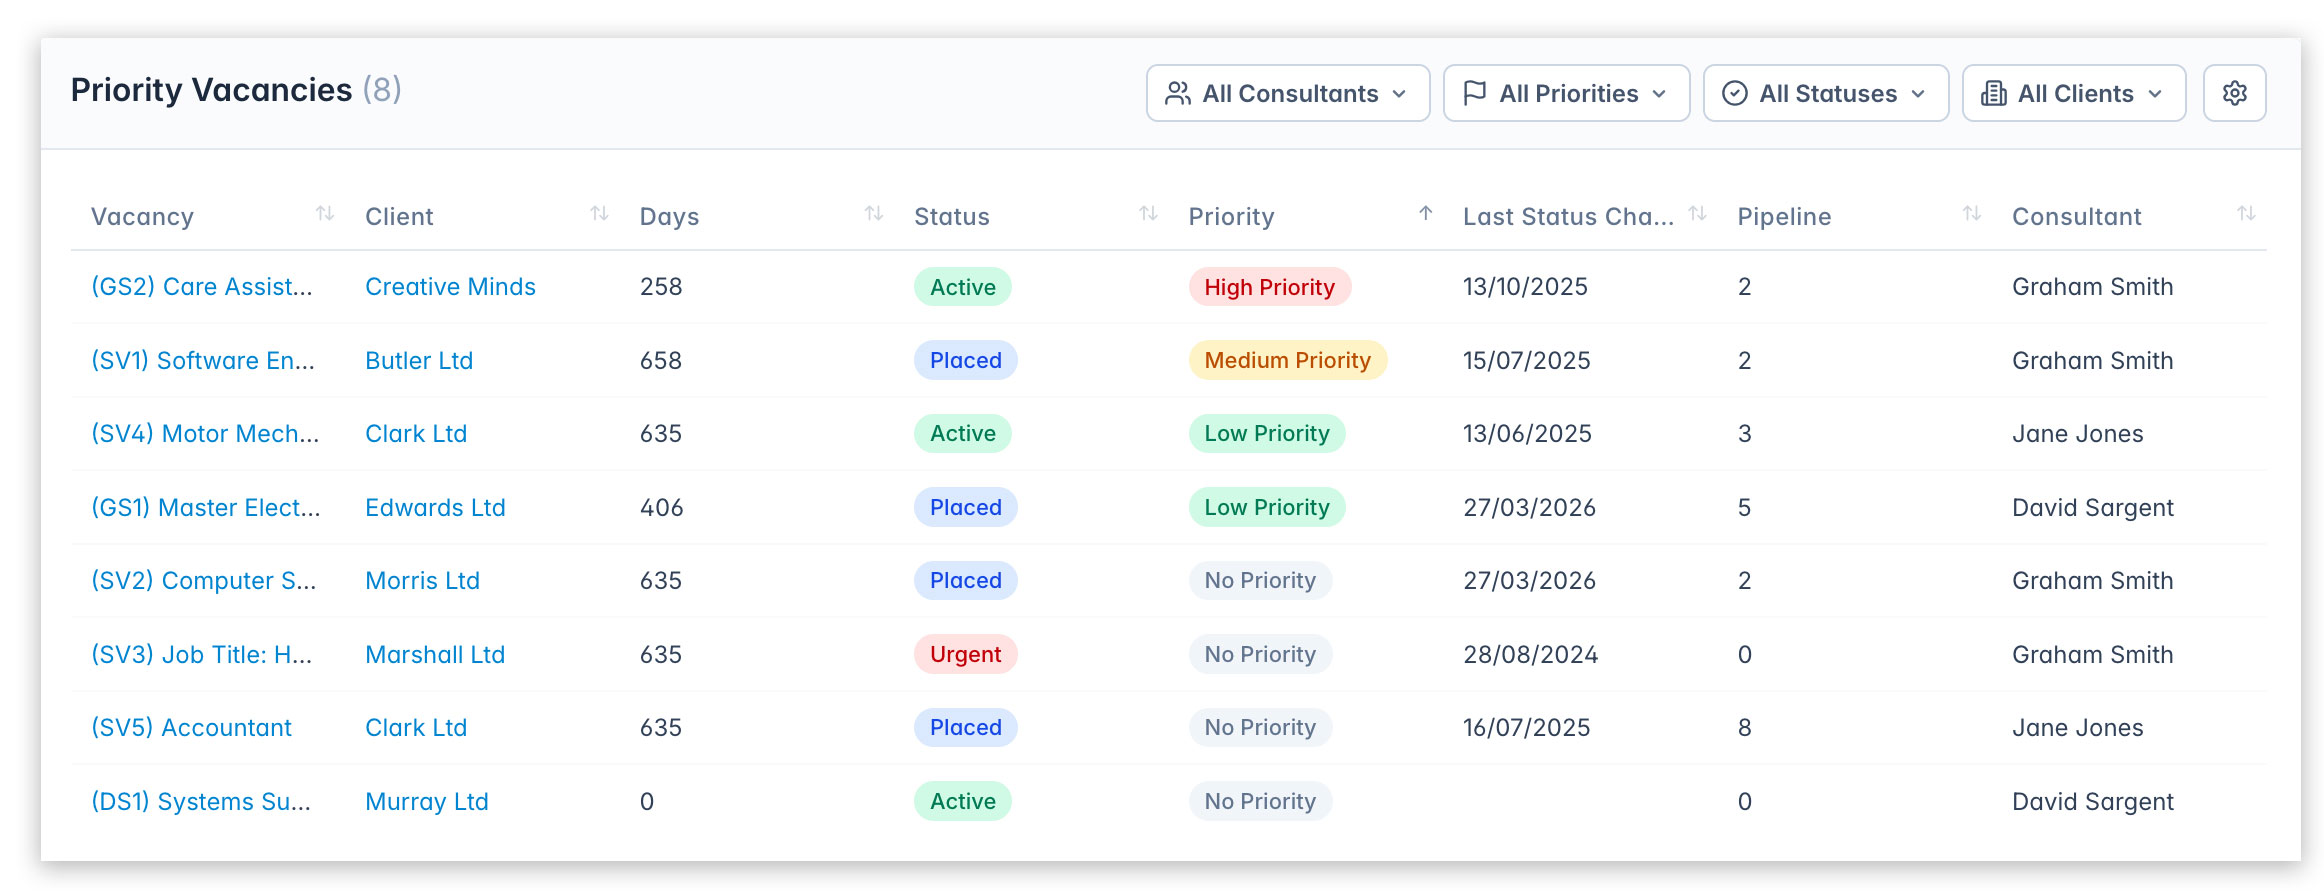
Priority Vacancies
Click to learn more…
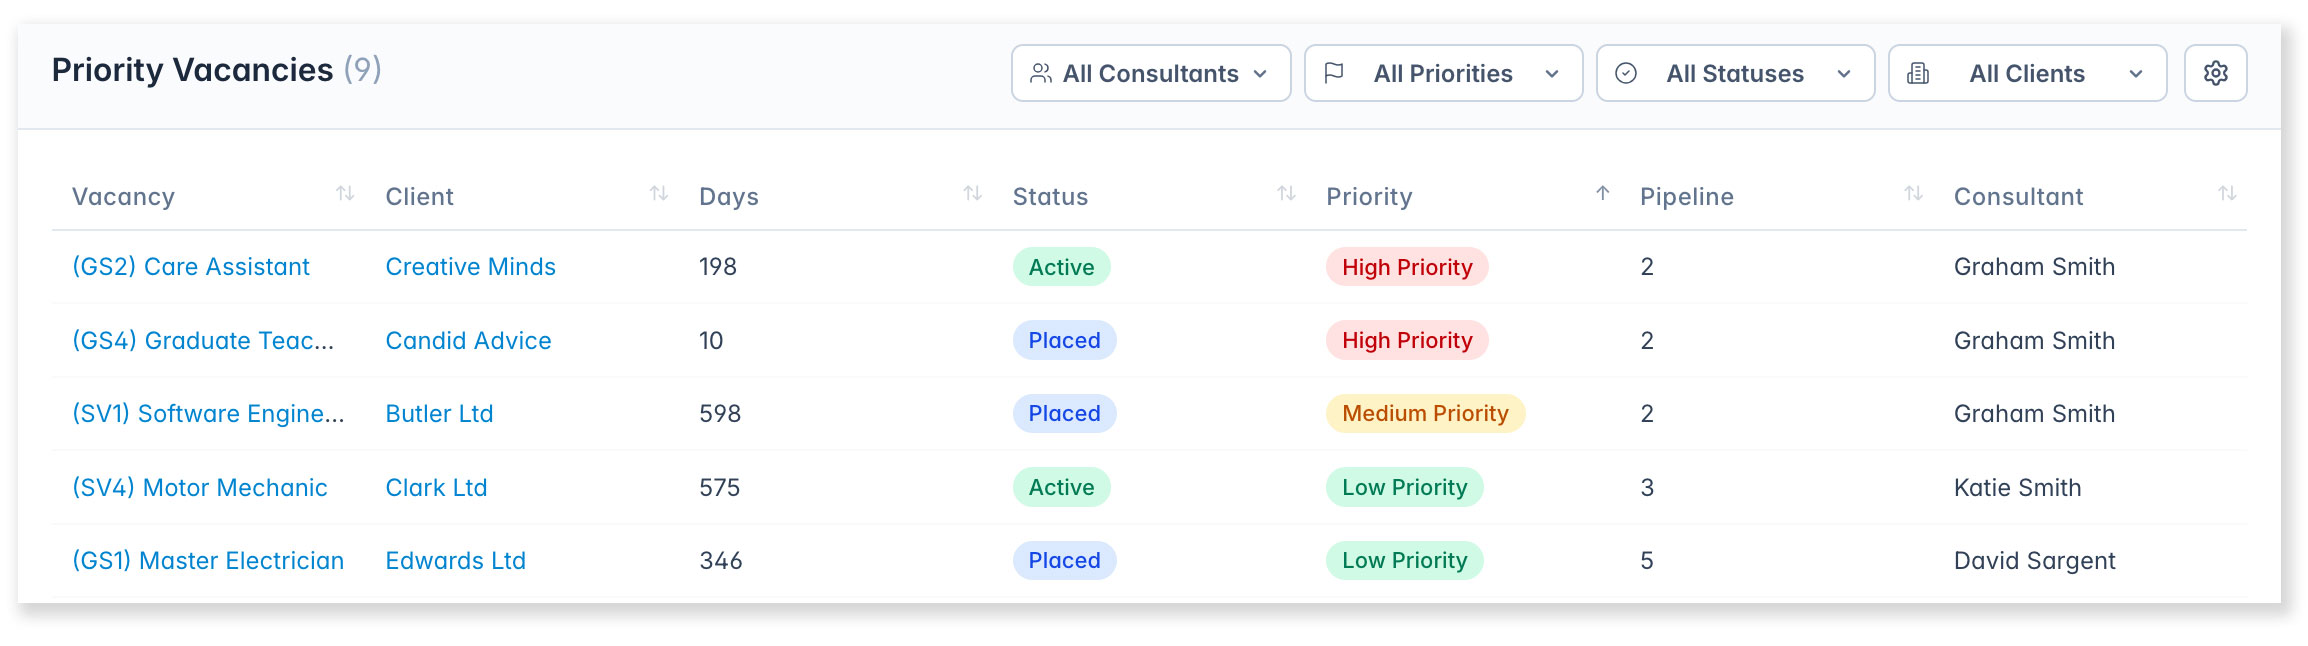
Keep your priority vacancies close to hand. You can set a vacancy’s priority from the Overview screen on the vacancy record.
The table displays open vacancies, sorted by priority (or any column). It includes: vacancy title, client, days open, status, priority, number of candidates in the pipeline, and consultant. You can customise which columns are shown and how data is displayed using the Filters and Settings options.
Status vs. Priority
Status is set automatically by the system based on factors such as how long the vacancy has been open and pipeline activity. For example, a vacancy that has been open for a long time with little pipeline progression may be flagged as Urgent.
Priority is set manually on the vacancy’s Overview screen, allowing you to control how vacancies are ranked and displayed.
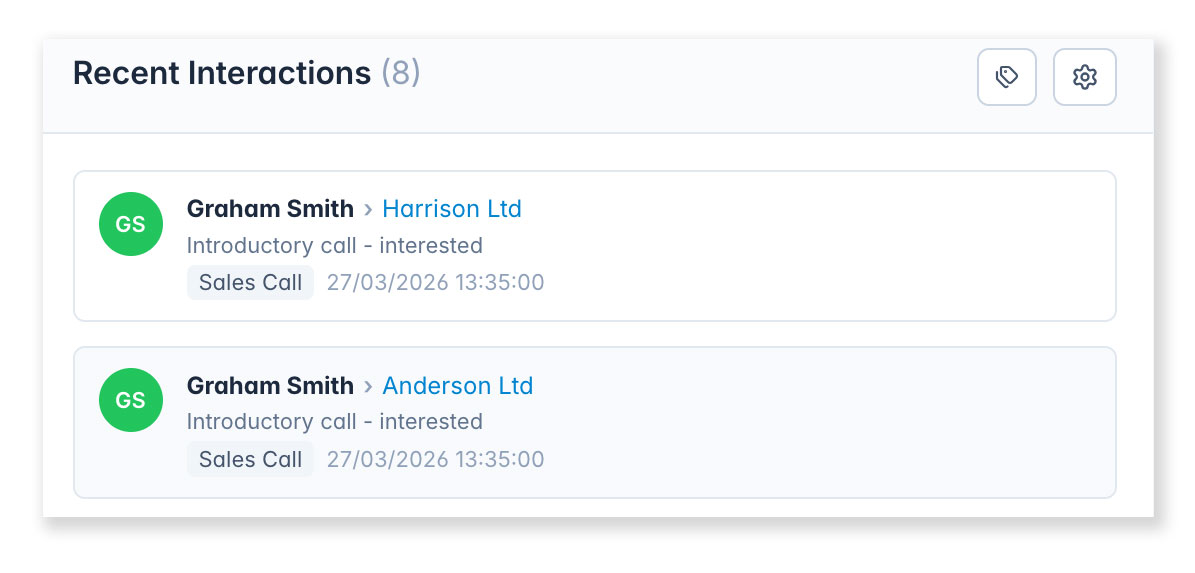
Recent Interactions
Click to learn more…
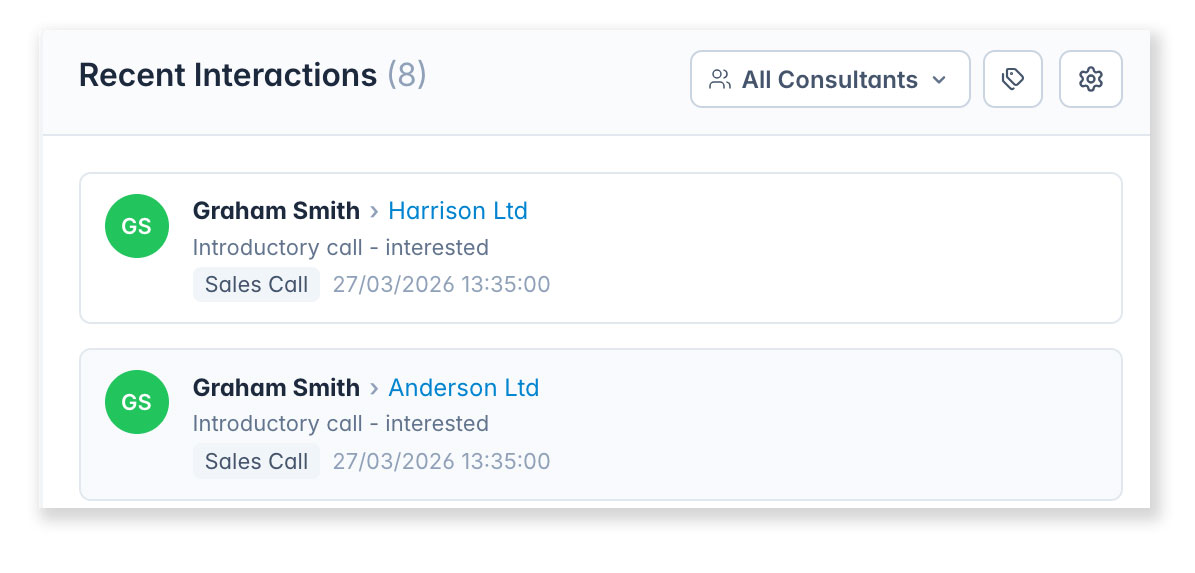
A feed of your recent interactions (journals that you have added). Choose which journal types to include from the filter.
Leaderboard
Click to show more…
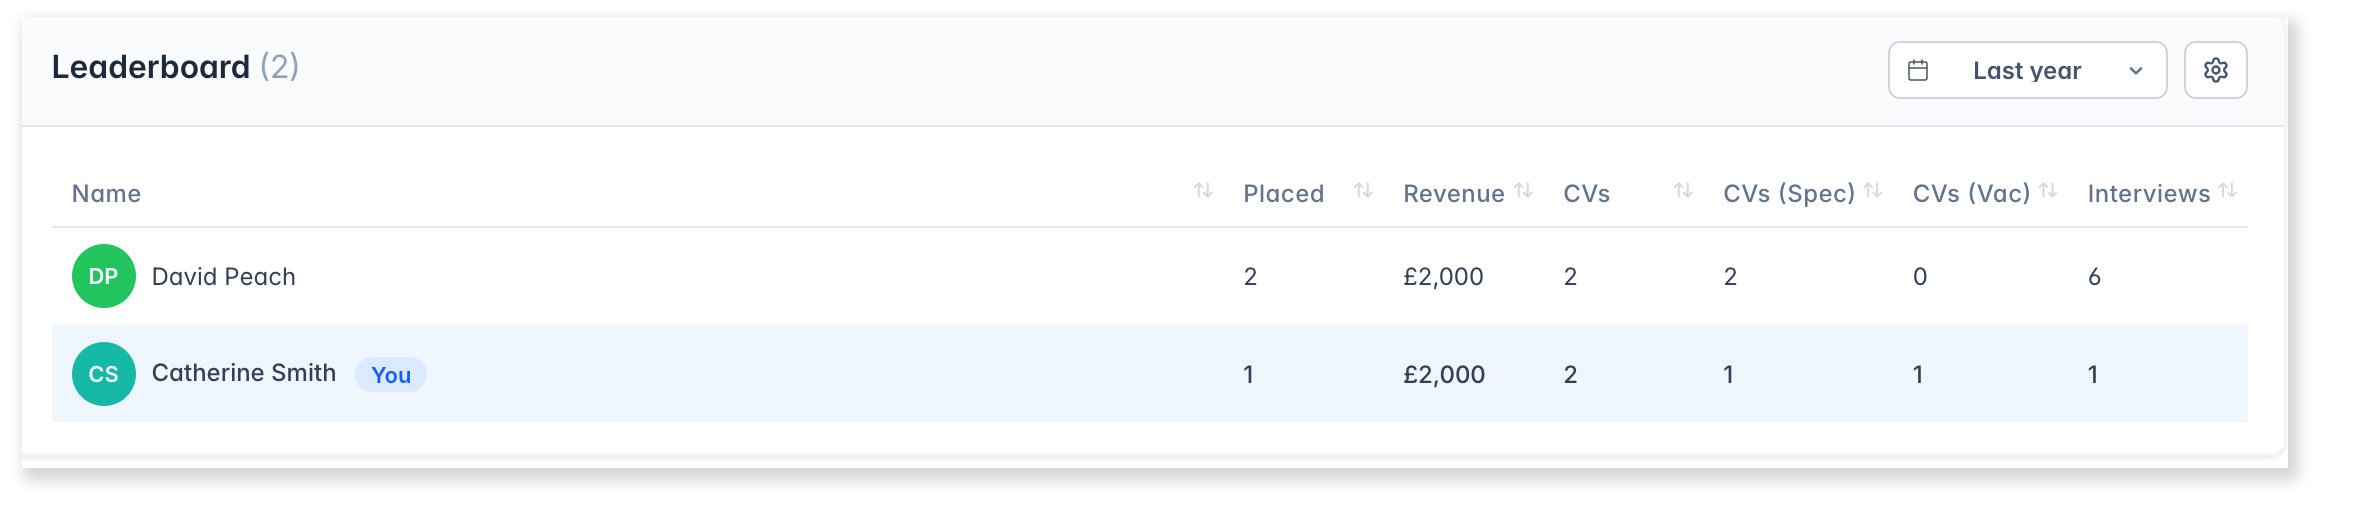
A team ranking table showing the top performers based on KPIs.
Choose and sort the Leaderboard by: placements made, interviews added, CVs sent and revenue generated. Your own row is highlighted. Use the Period filter to change the date range and choose which columns are shown in the Settings menu.
Recent Mentions
Click to show more…
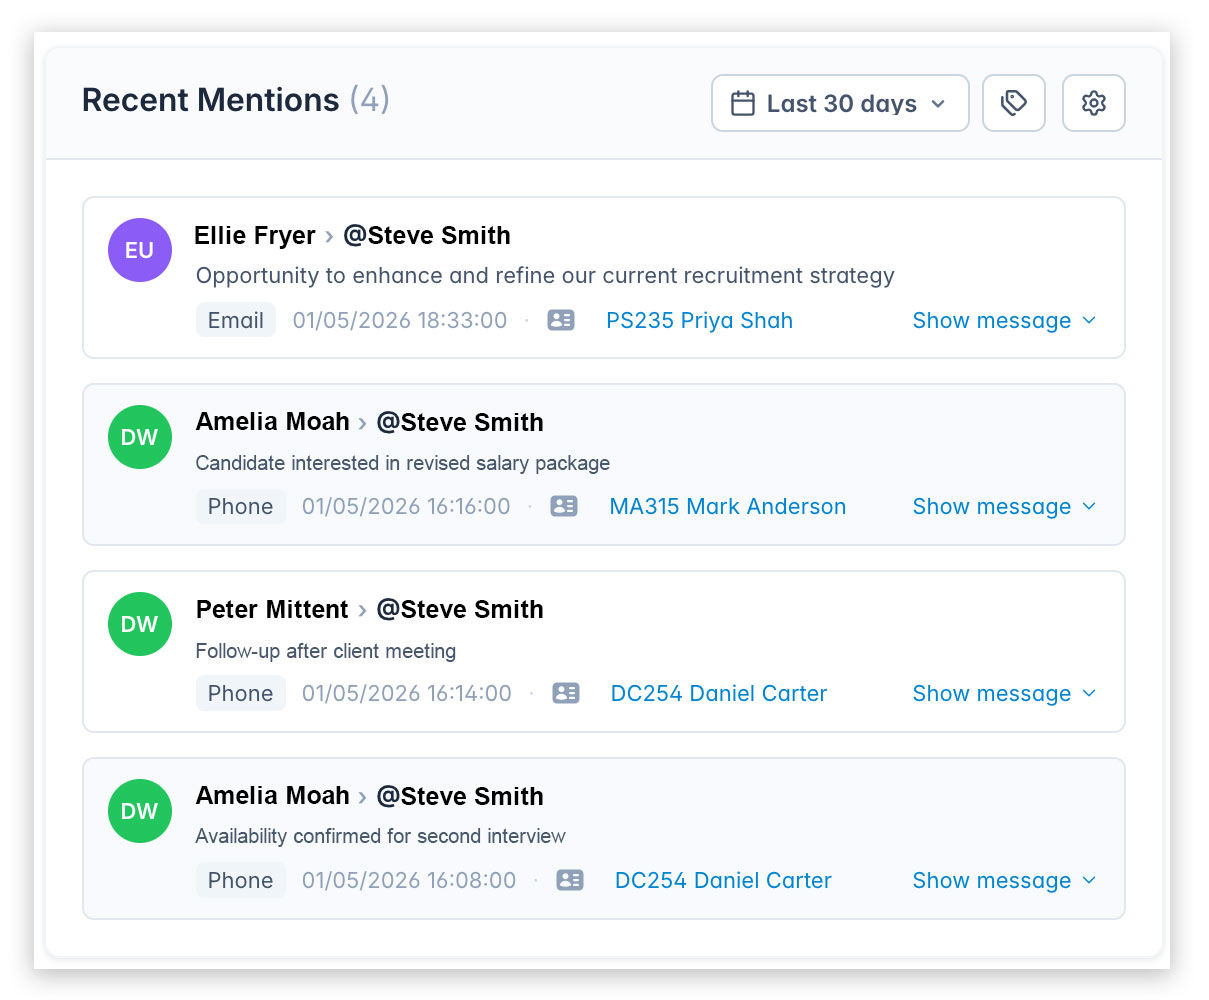
Add the Recent Mentions dashboard widget, available on the Consultant View, to see who has mentioned you and in which journals
- Filter by journal type – only journal types containing mentions of you will be shown.
- Click Show Message to view the journal entry.
- Click Quick Preview to preview the candidate’s record.
Management Tab
Click to learn more…
Overview
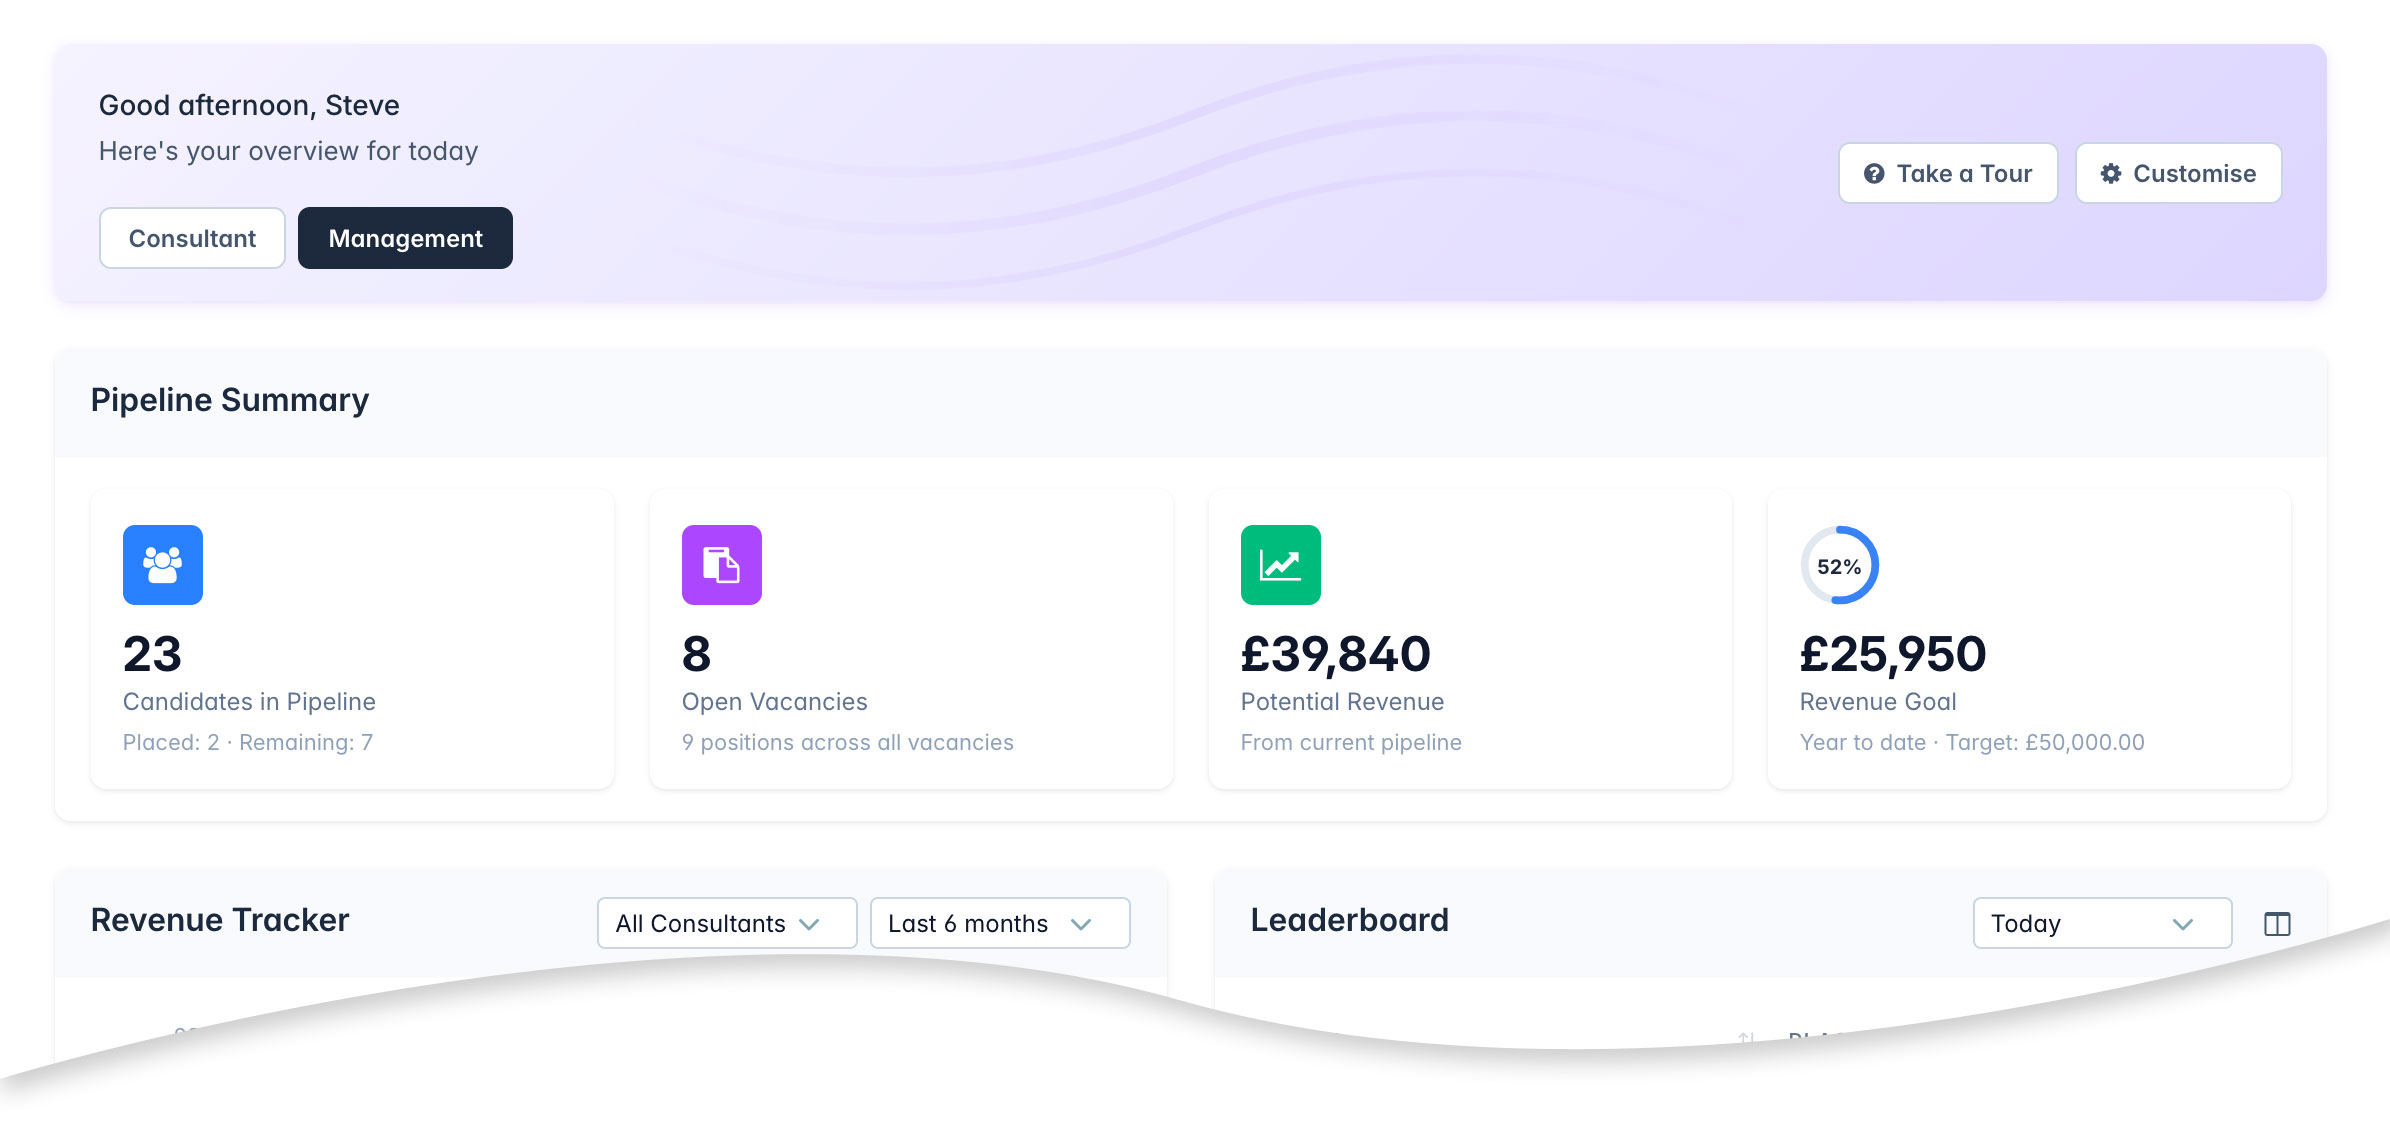
The management tab provides a company-wide overview. All data covers the entire team unless filtered by consultant or team.
High-level summary cards showing the total number of open vacancies, active candidates in pipelines, interviews scheduled, and placements. Gives a snapshot of overall recruitment activity across all consultants.
A company wide revenue goal can be set in [Settings > System Settings > Goals]. Click Add Goal, choose Revenue, set your target and choose Company from the Type option.
Management view widgets
Revenue
Click to learn more…
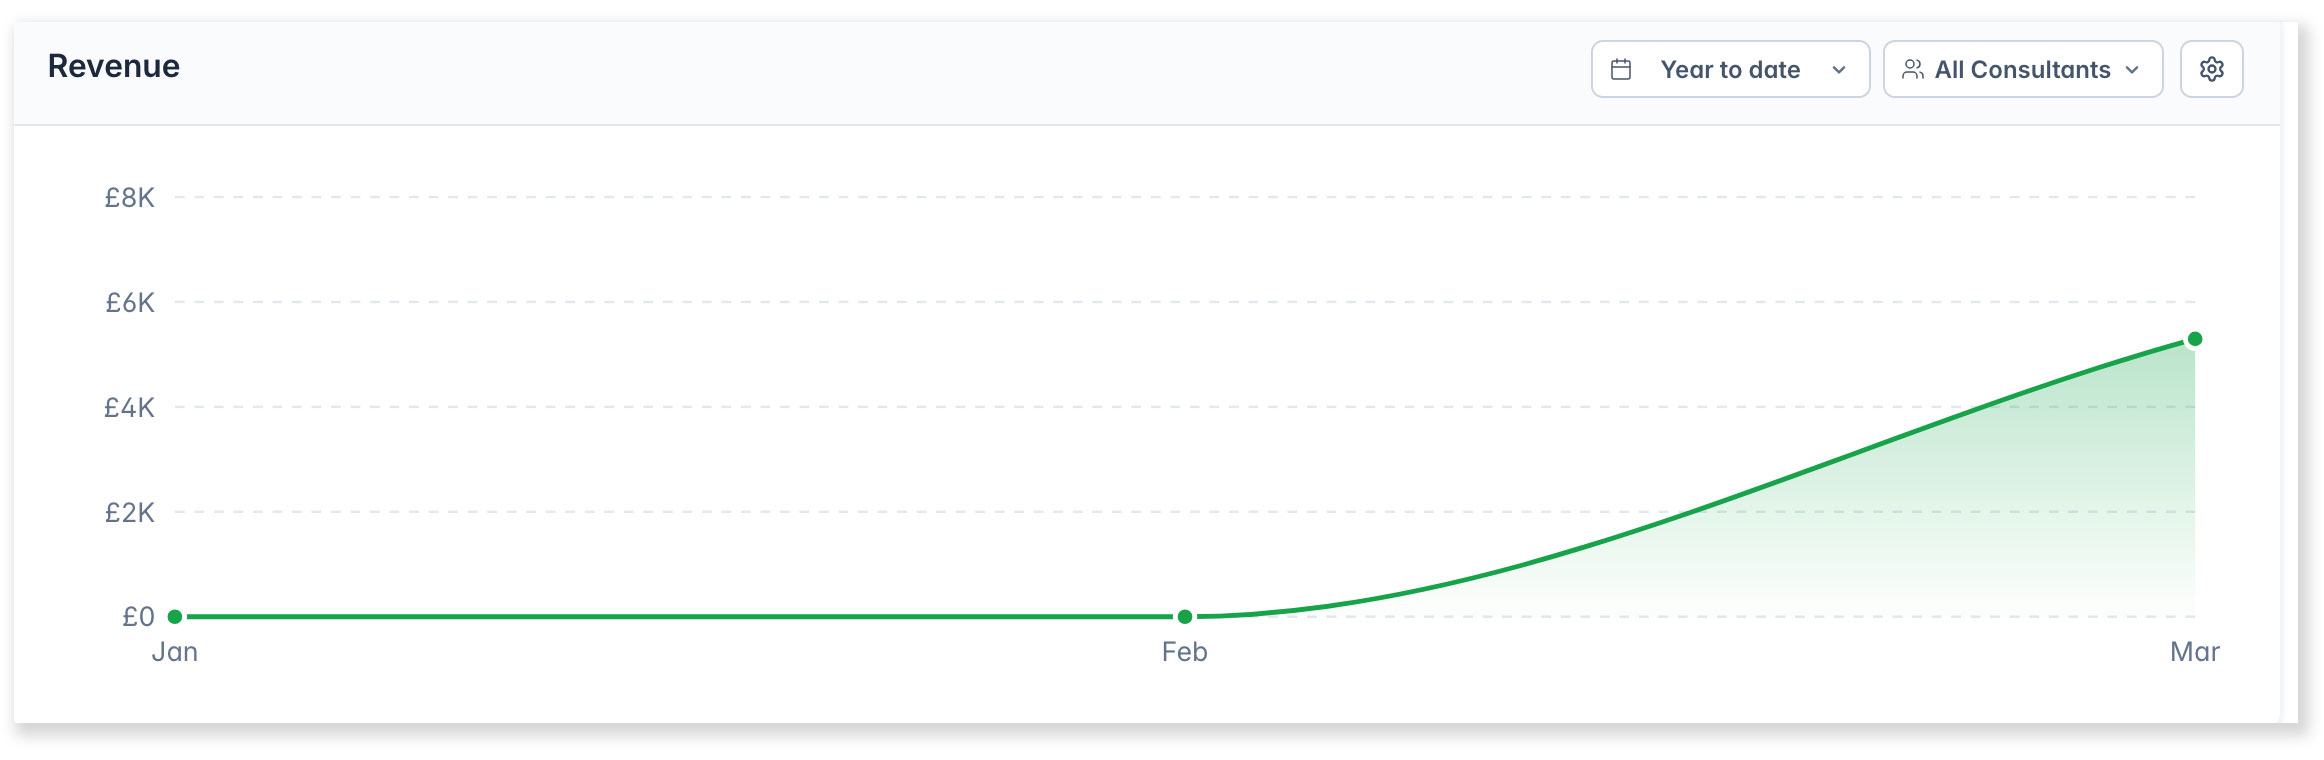
A line chart showing monthly revenue from placements over time. Revenue is calculated from placement fees recorded against placed candidates. Use the Consultant/Team filter to view a specific person or team, and the Period filter to adjust the date range.
Leaderboard
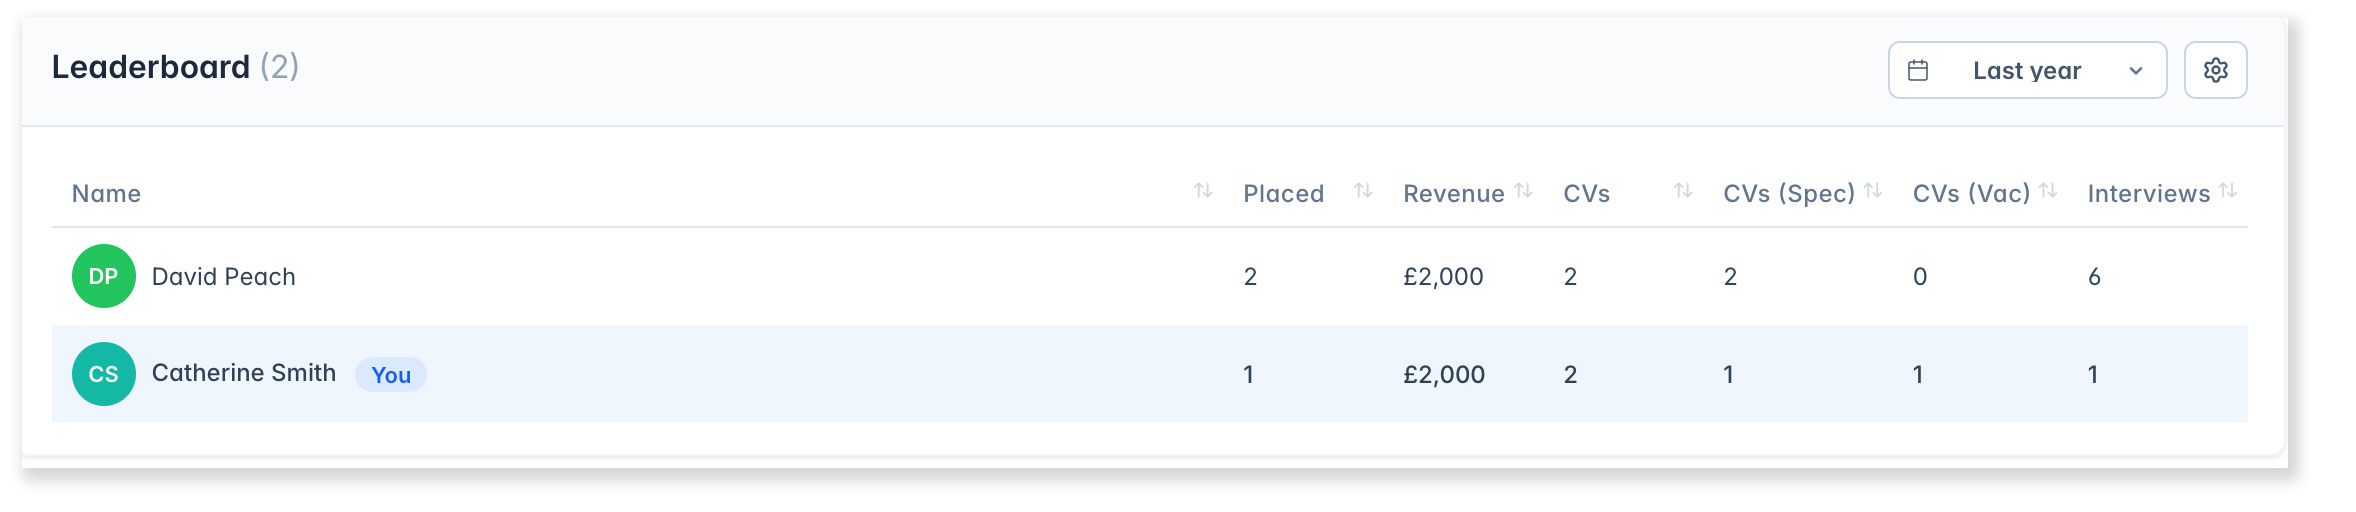
Click to learn more…
A team ranking table showing the top 10 consultants by a composite score calculated from placements, interviews, and CVs sent. Use the Period filter to change the date range. Columns can be customised to show Revenue, Speculative CVs, and Vacancy CVs alongside the defaults.
CV Stats
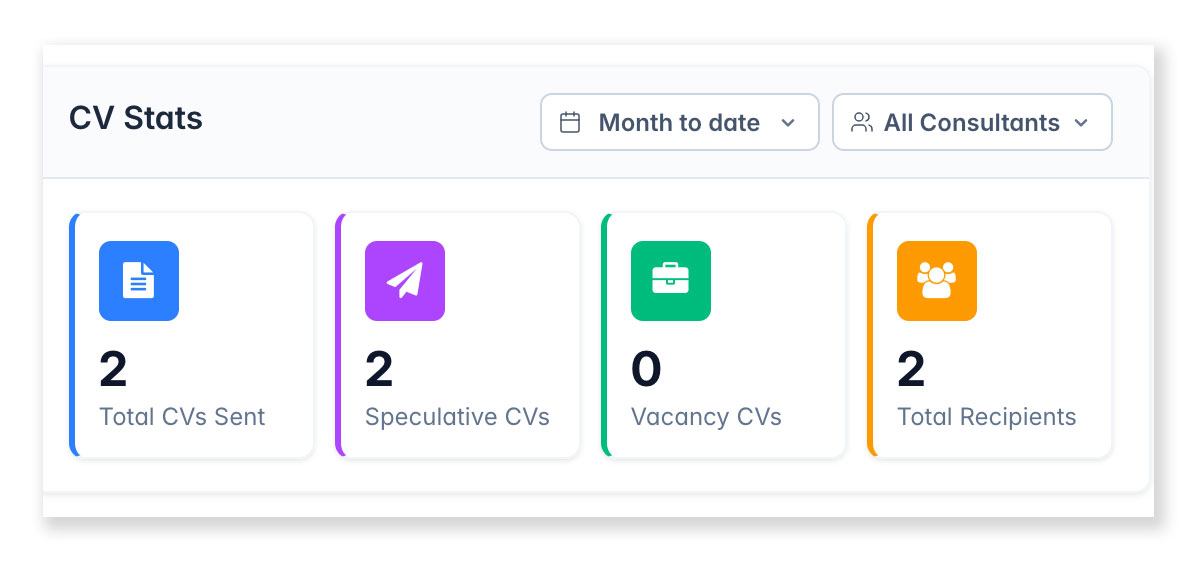
Click to learn more…
Company-wide CV sending statistics including total CVs sent, speculative CVs, vacancy CVs, and unique recipients. Use the Consultant/Team filter to narrow to a specific person or team, and the Period filter to change the date range.
Note: This is only for CVs emailed from the database – click here for further details.
Pipeline
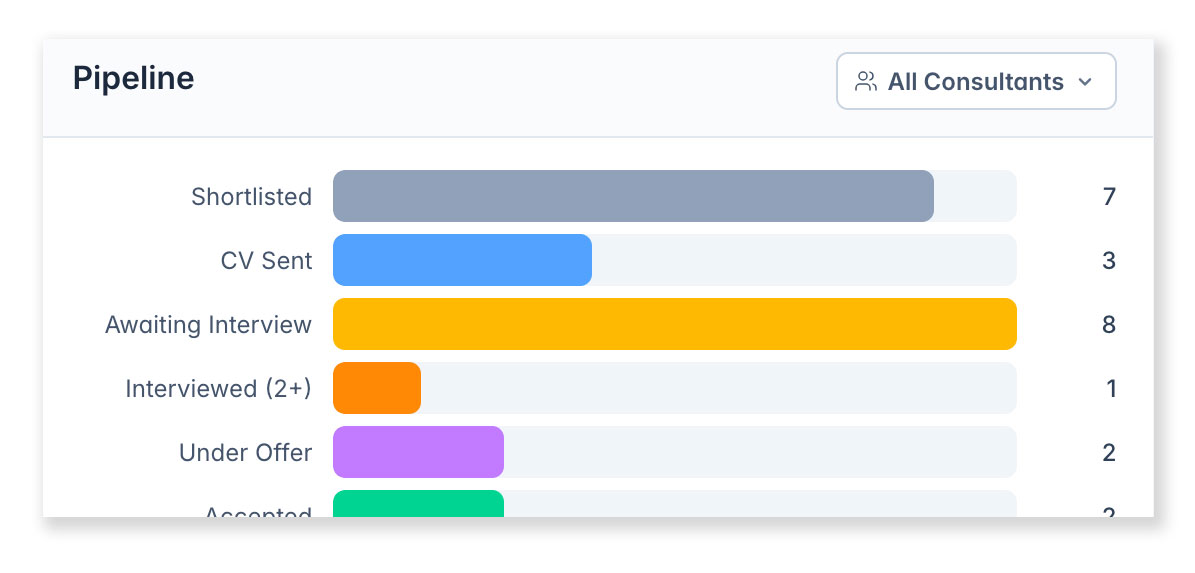
Click to learn more…
A current snapshot of candidates at each pipeline stage across all open vacancies.
Hiring Activity
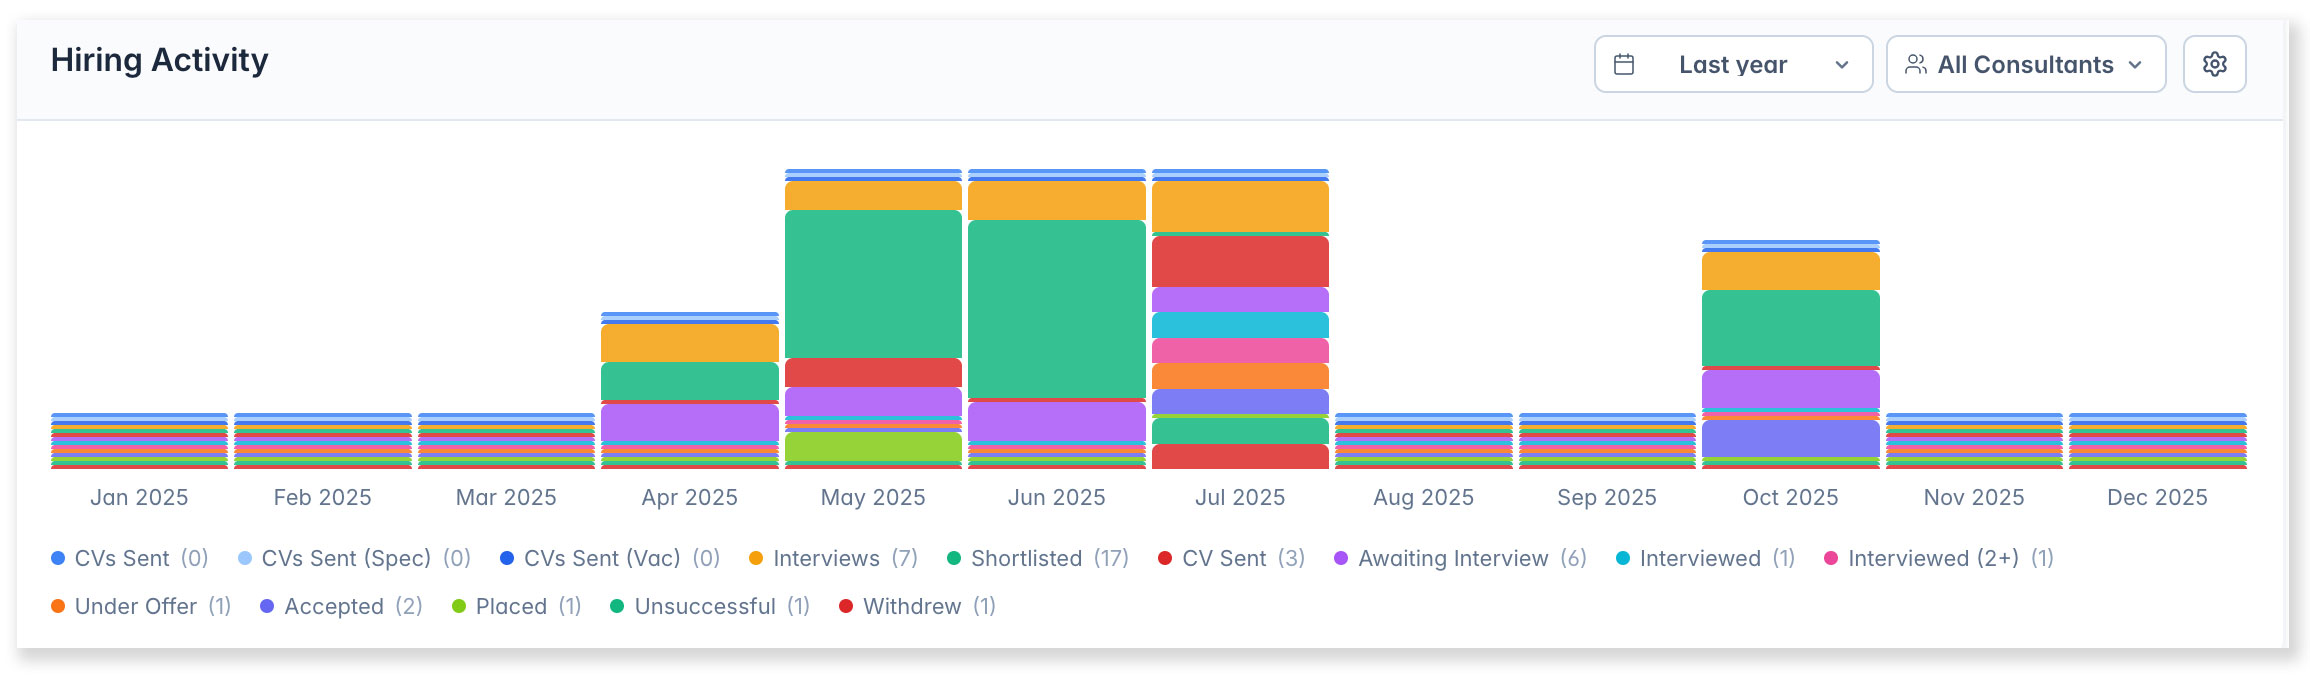
Click to learn more…
A chart showing recruitment activity trends over time, including CVs sent and interviews scheduled. Displays data as a bar chart grouped by time period. Use the Consultant/Team and Period filters to narrow the results.
Priority Vacancies
Click to learn more…
You can set a vacancy’s priority from the vacancy record’s Overview screen. A vacancy’s priority is also displayed in [Dashboard > Pipeline] when in Vacancy View.
Status vs. Priority
Status is set automatically by the system, based on how long the vacancy has been open and its pipeline activity. For example, a vacancy that has been open for a long time with little pipeline progression may be flagged as Urgent.
Priority is set manually on the vacancy record’s Details screen. You can also choose which columns to display using the widget’s column picker.
Interviews
Click to learn more…
A table of upcoming interviews scheduled in the next 14 days across the company. Shows the candidate, consultant, vacancy, date, and time. Use the Consultant/Team filter to narrow to a specific person or team.
Time to Fill
Click to learn more…
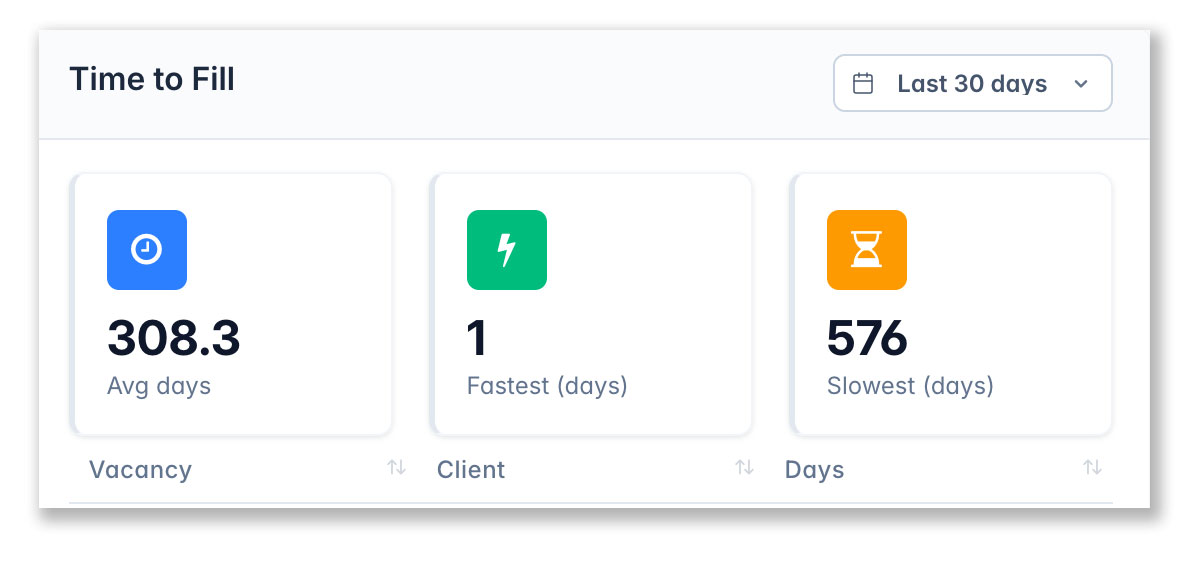
Shows how long it takes to fill vacancies, displaying the average, fastest, and slowest time to fill in days. Calculated from the date a vacancy was opened to the date a placement was made. Use the Period filter to change the date range.
Client Activity
Click to learn more…
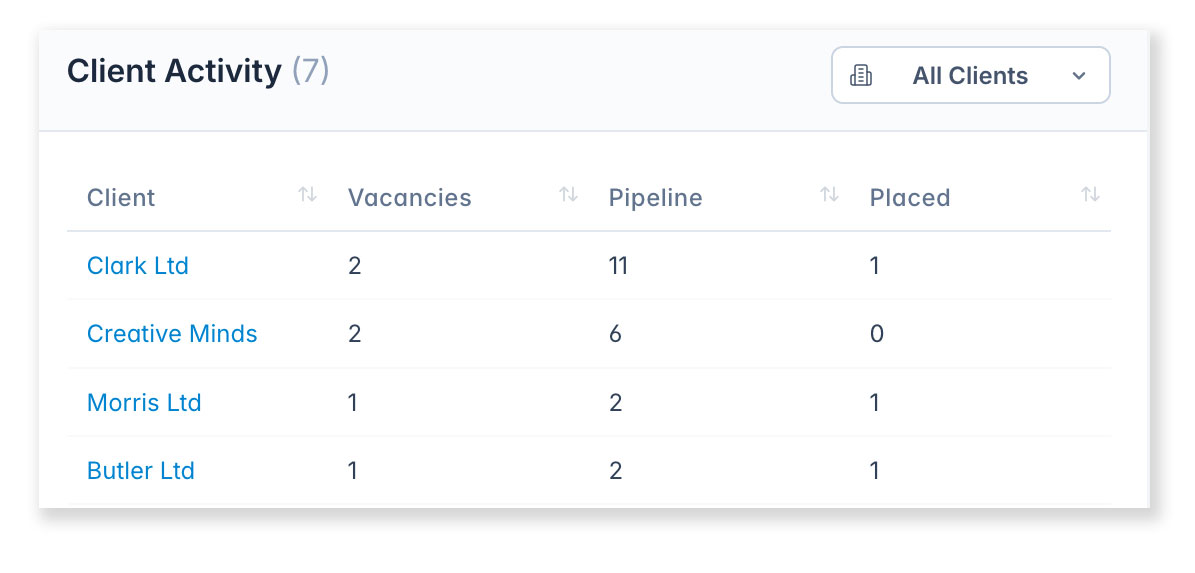
A summary of recent activity by client, showing which clients have had the most recruitment activity (CVs sent, interviews, placements) recently. Helps identify your most active client accounts.
Recent Activity
Click to learn more…
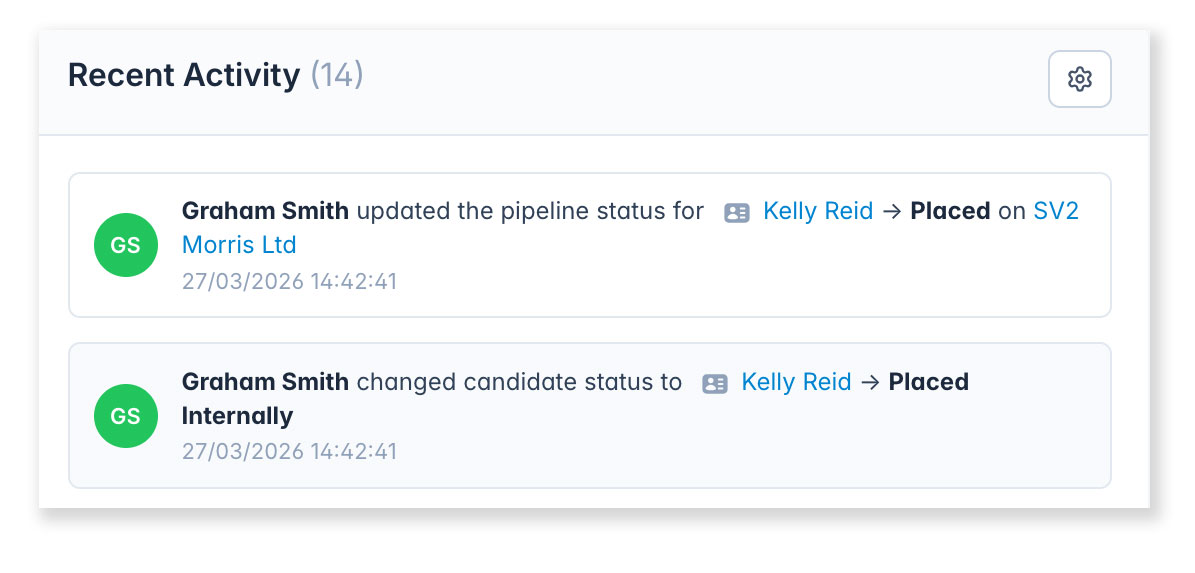
A live news feed of the latest actions taken across the system, such as candidates added, CVs sent, interviews scheduled, vacancies created, and pipeline updates. Shows the consultant name, action, and timestamp.
Consultant Log
Click to learn more…
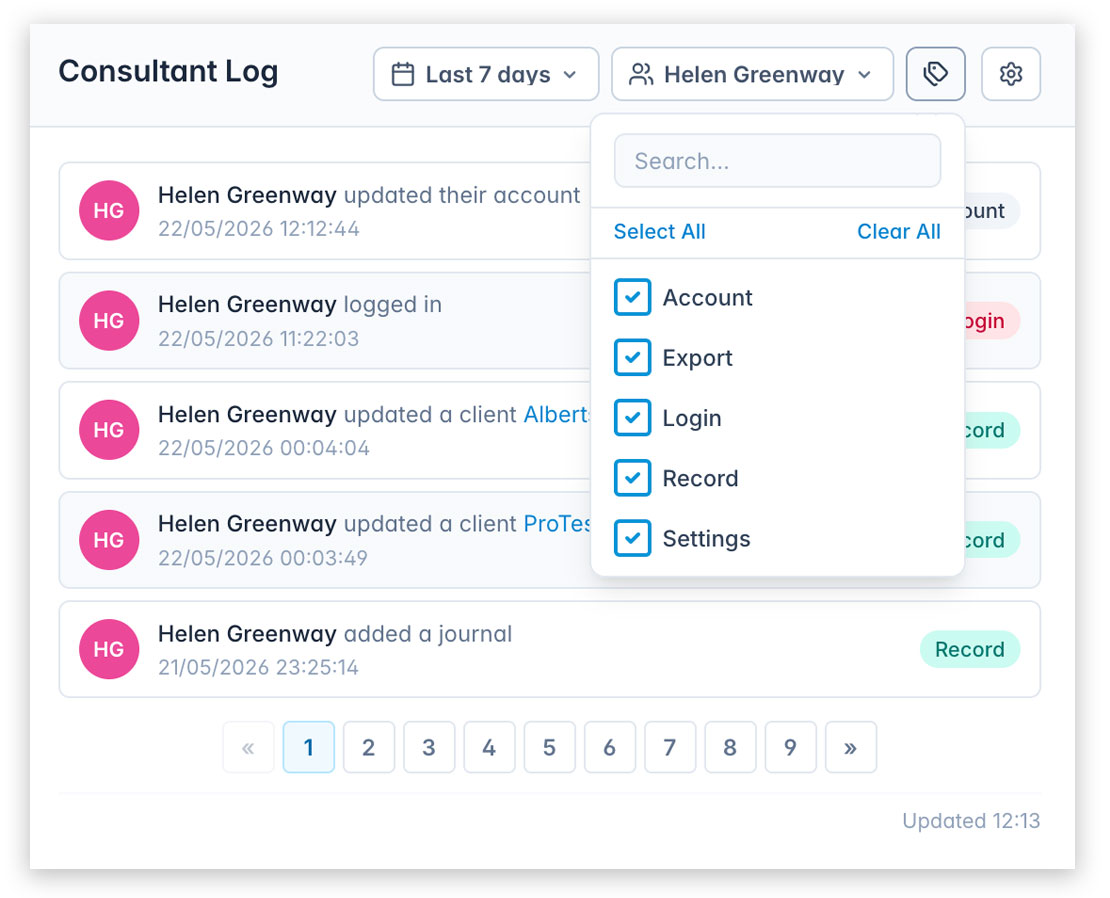
See a log of consultant activity over the last 7 days. This can be filtered by time period, consultant and activity type:
- Account: A setting was changed in the user’s [Settings > My Account > …]
- Export: Data was exported.
This may have been from one of the main grids via [Actions > Export to CSV], or from [Settings > System Settings > Data Export]. - Login: The date and time a user logged into the system.
- Record: A record was updated.
This is intended only to indicate that a record was changed – the specific changes are not recorded. - Settings: A change was made in [Settings > System Settings]. The item that was changed is also shown.
Active Now
Click to learn more…
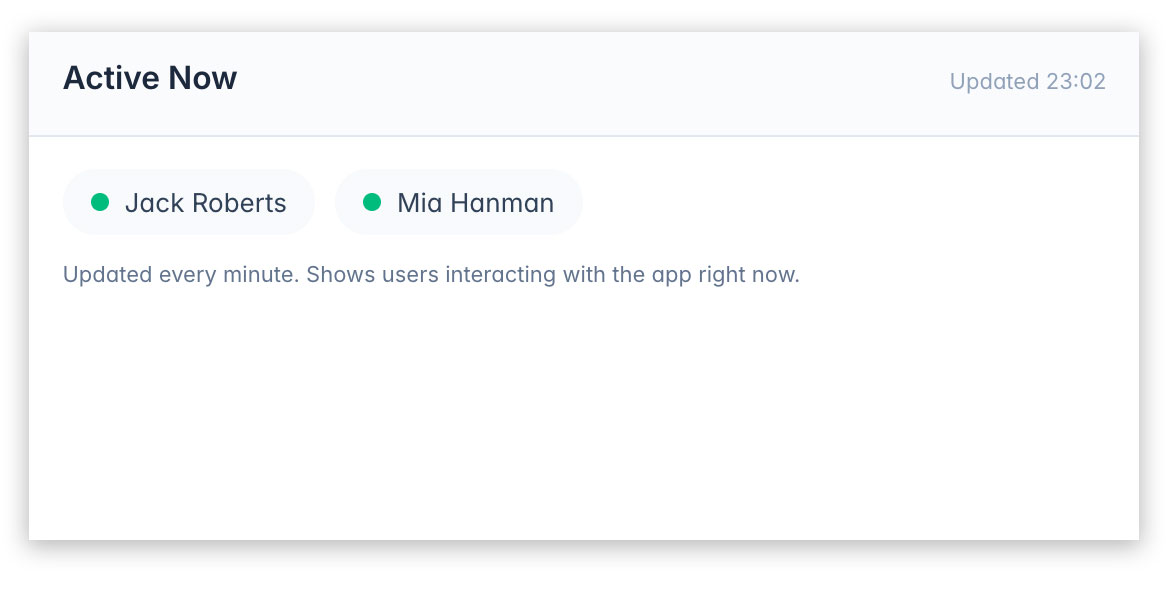
While the Consultant Log (above) provides a history of consultant activity, Active Now shows which consultants are currently logged into the database and actively interacting with the system.
Candidate Sources
Click to learn more…
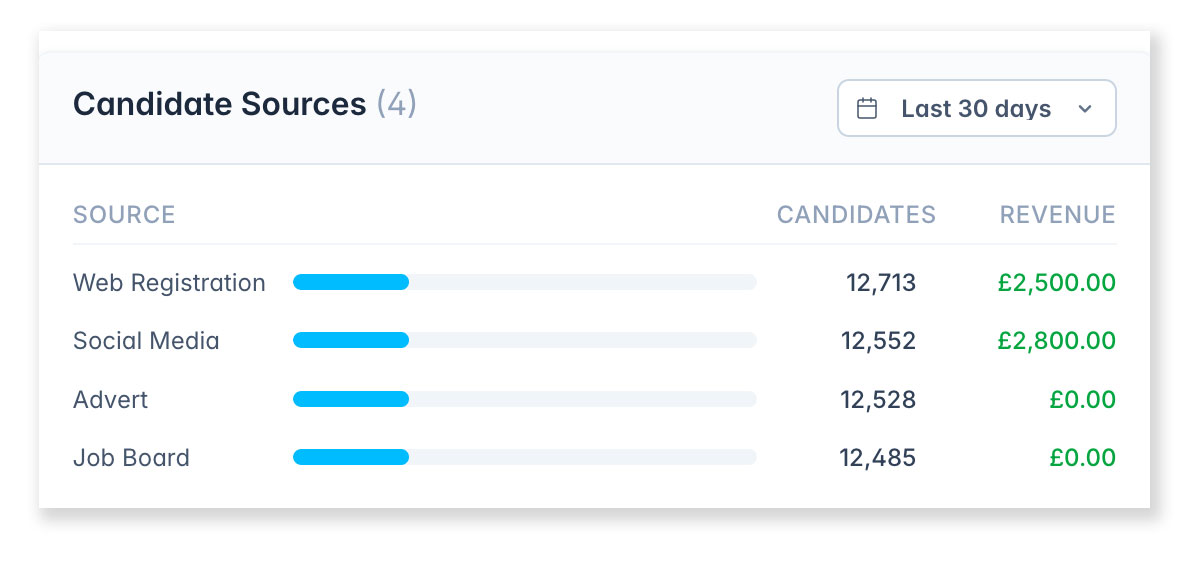
A bar chart showing where your candidates are coming from (e.g. job boards, referrals, website, LinkedIn). Data is based on the source field recorded against each candidate record.
Recent Interactions
Click to learn more…
A feed of recent interactions based on journal types (emails, calls, meetings) across all consultants. Shows the date, type, subject, and related record. Use the Consultant/Team filter to view a specific person or team.
Goals
Click to learn more…
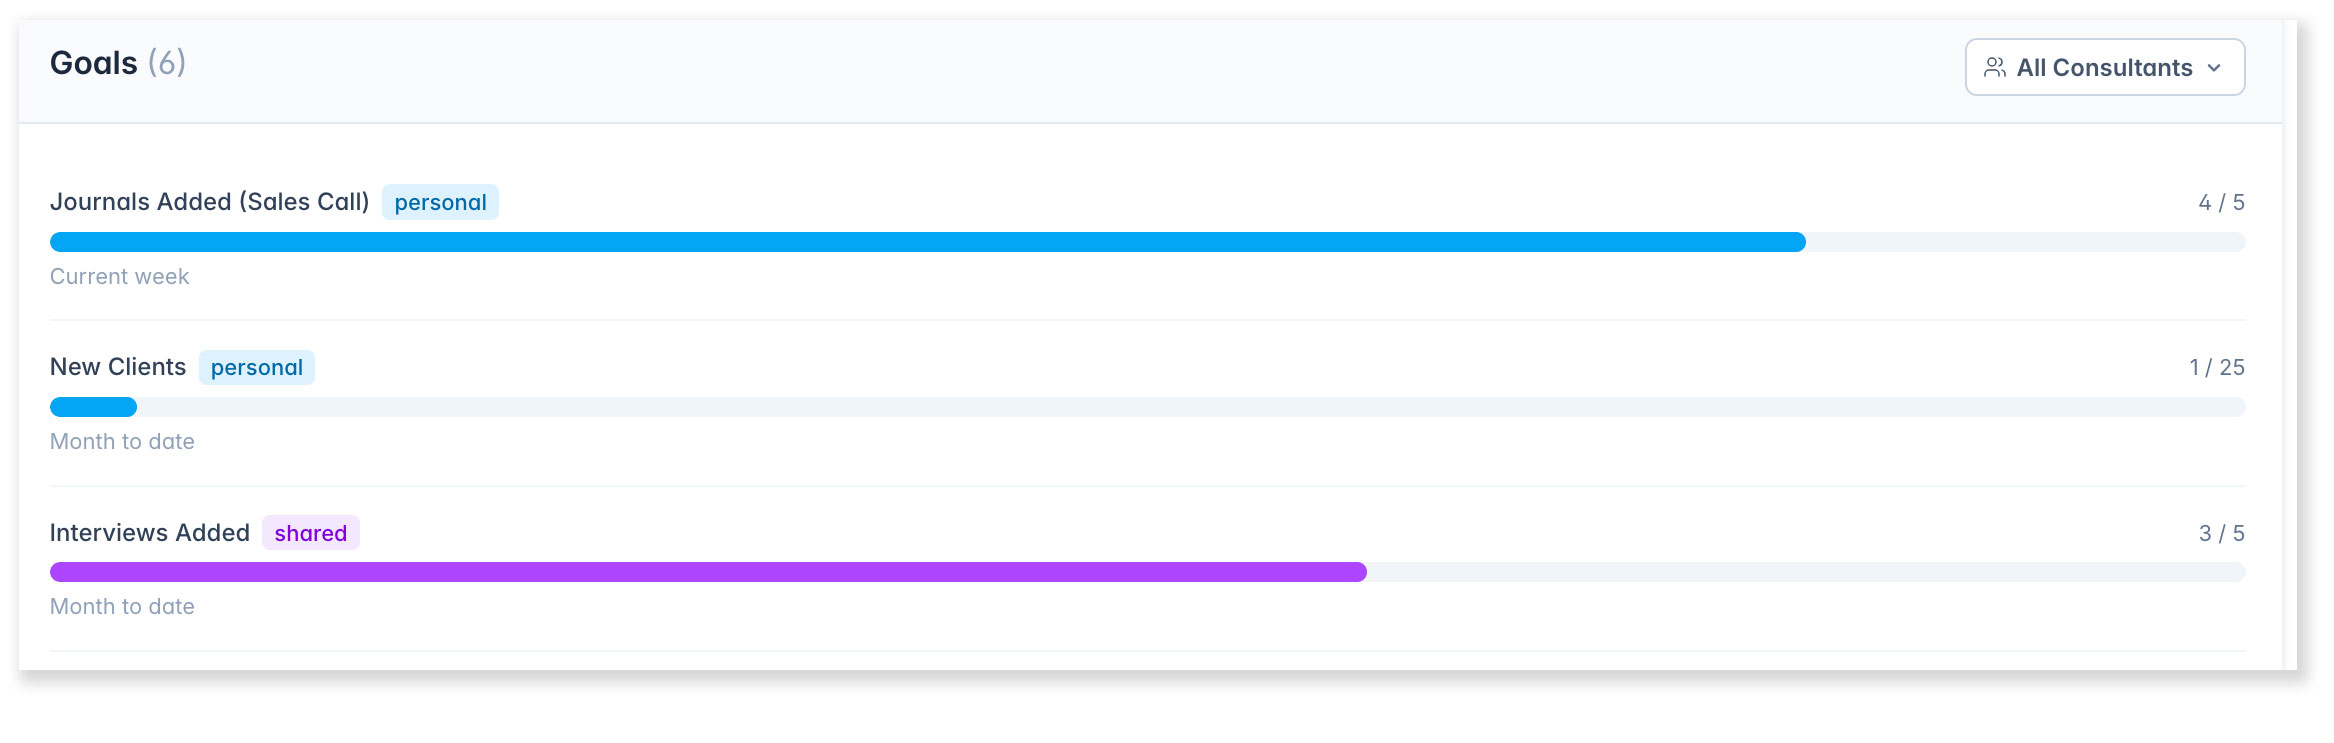
An overview of goal progress across the team. Shows each consultant’s goals, targets, and current achievement. Use the Consultant/Team filter to focus on a specific person or team. Goals are configured under Settings > Goals.
Propects
Click to learn more…
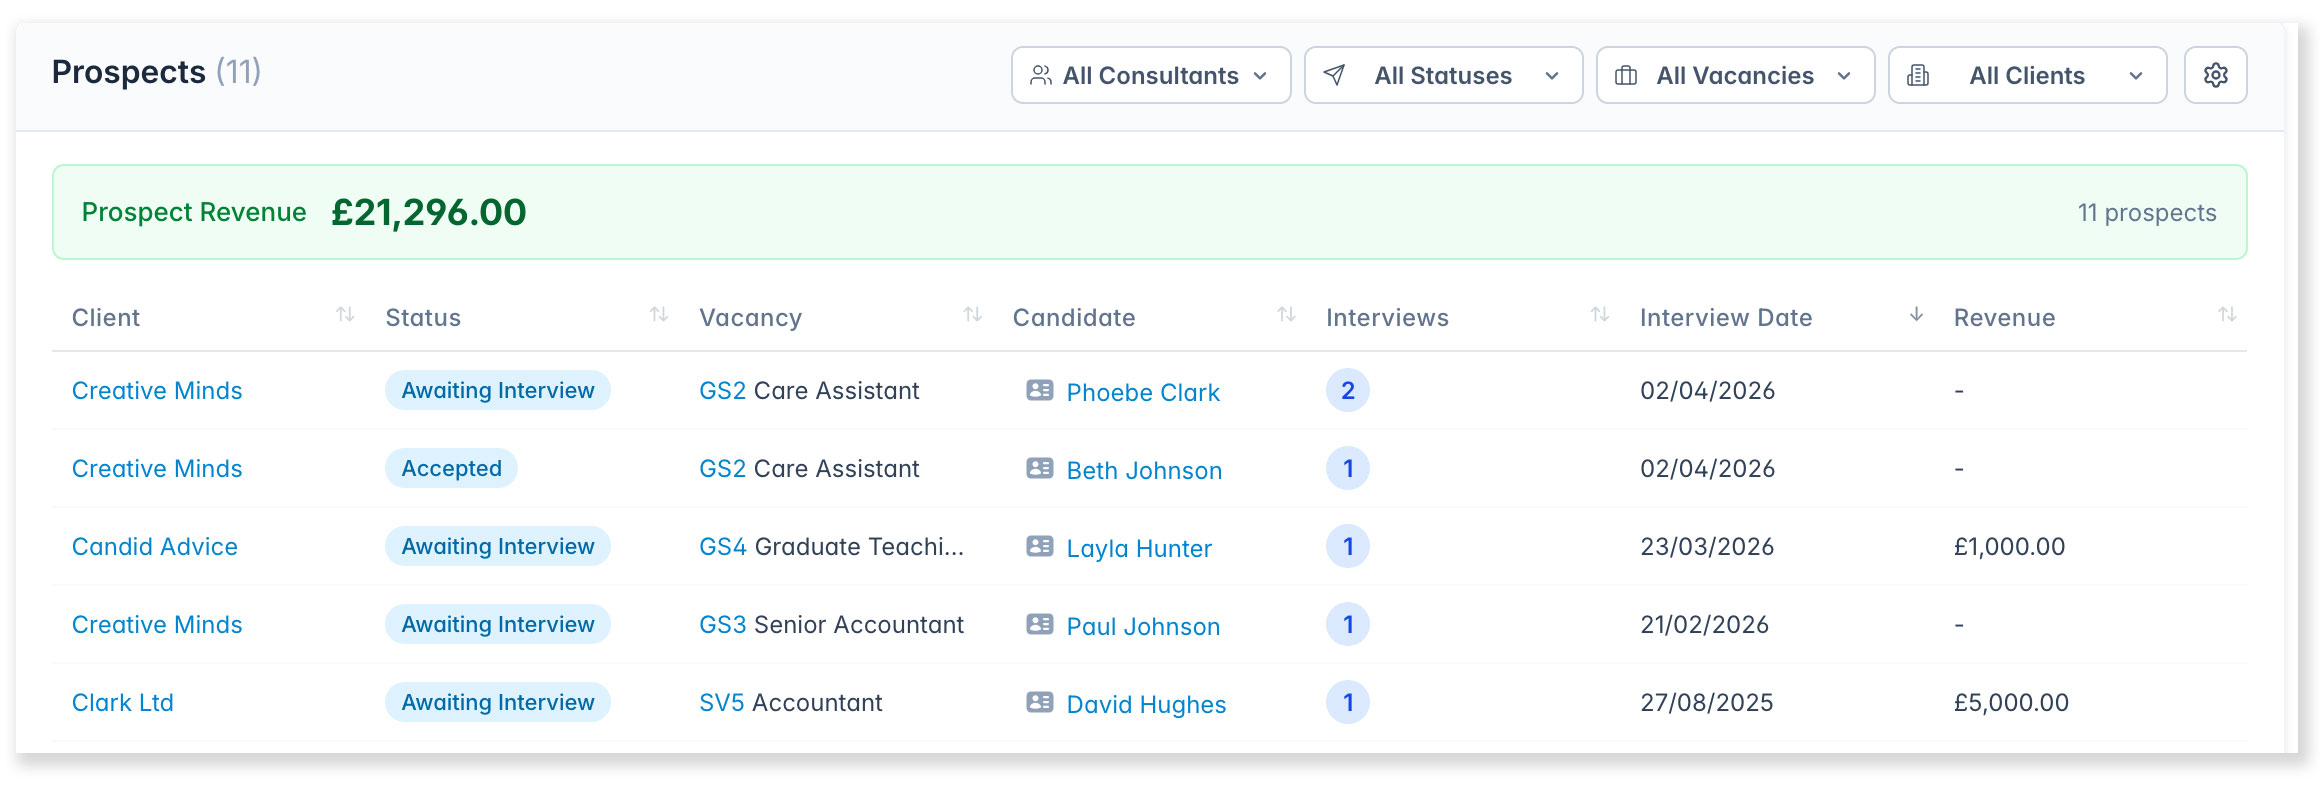
This shows the value of candidates at interview stage, giving an attainable potential revenue for vacancies at a critical stage.
The widget can be filtered by:
- Consultant (of the candidate, vacancy or client)
- Pipeline status(es)
- Vacancy
- Client
Dashboard Widget Permissions
Administrators can control which dashboard widgets are available to consultants on the Consultant Tab. This is managed per permission group under [Settings > System Settings > Permissions].
To configure widget permissions, click on a permission group to expand it and scroll down to the Dashboard Widgets (Consultant Tab) section.
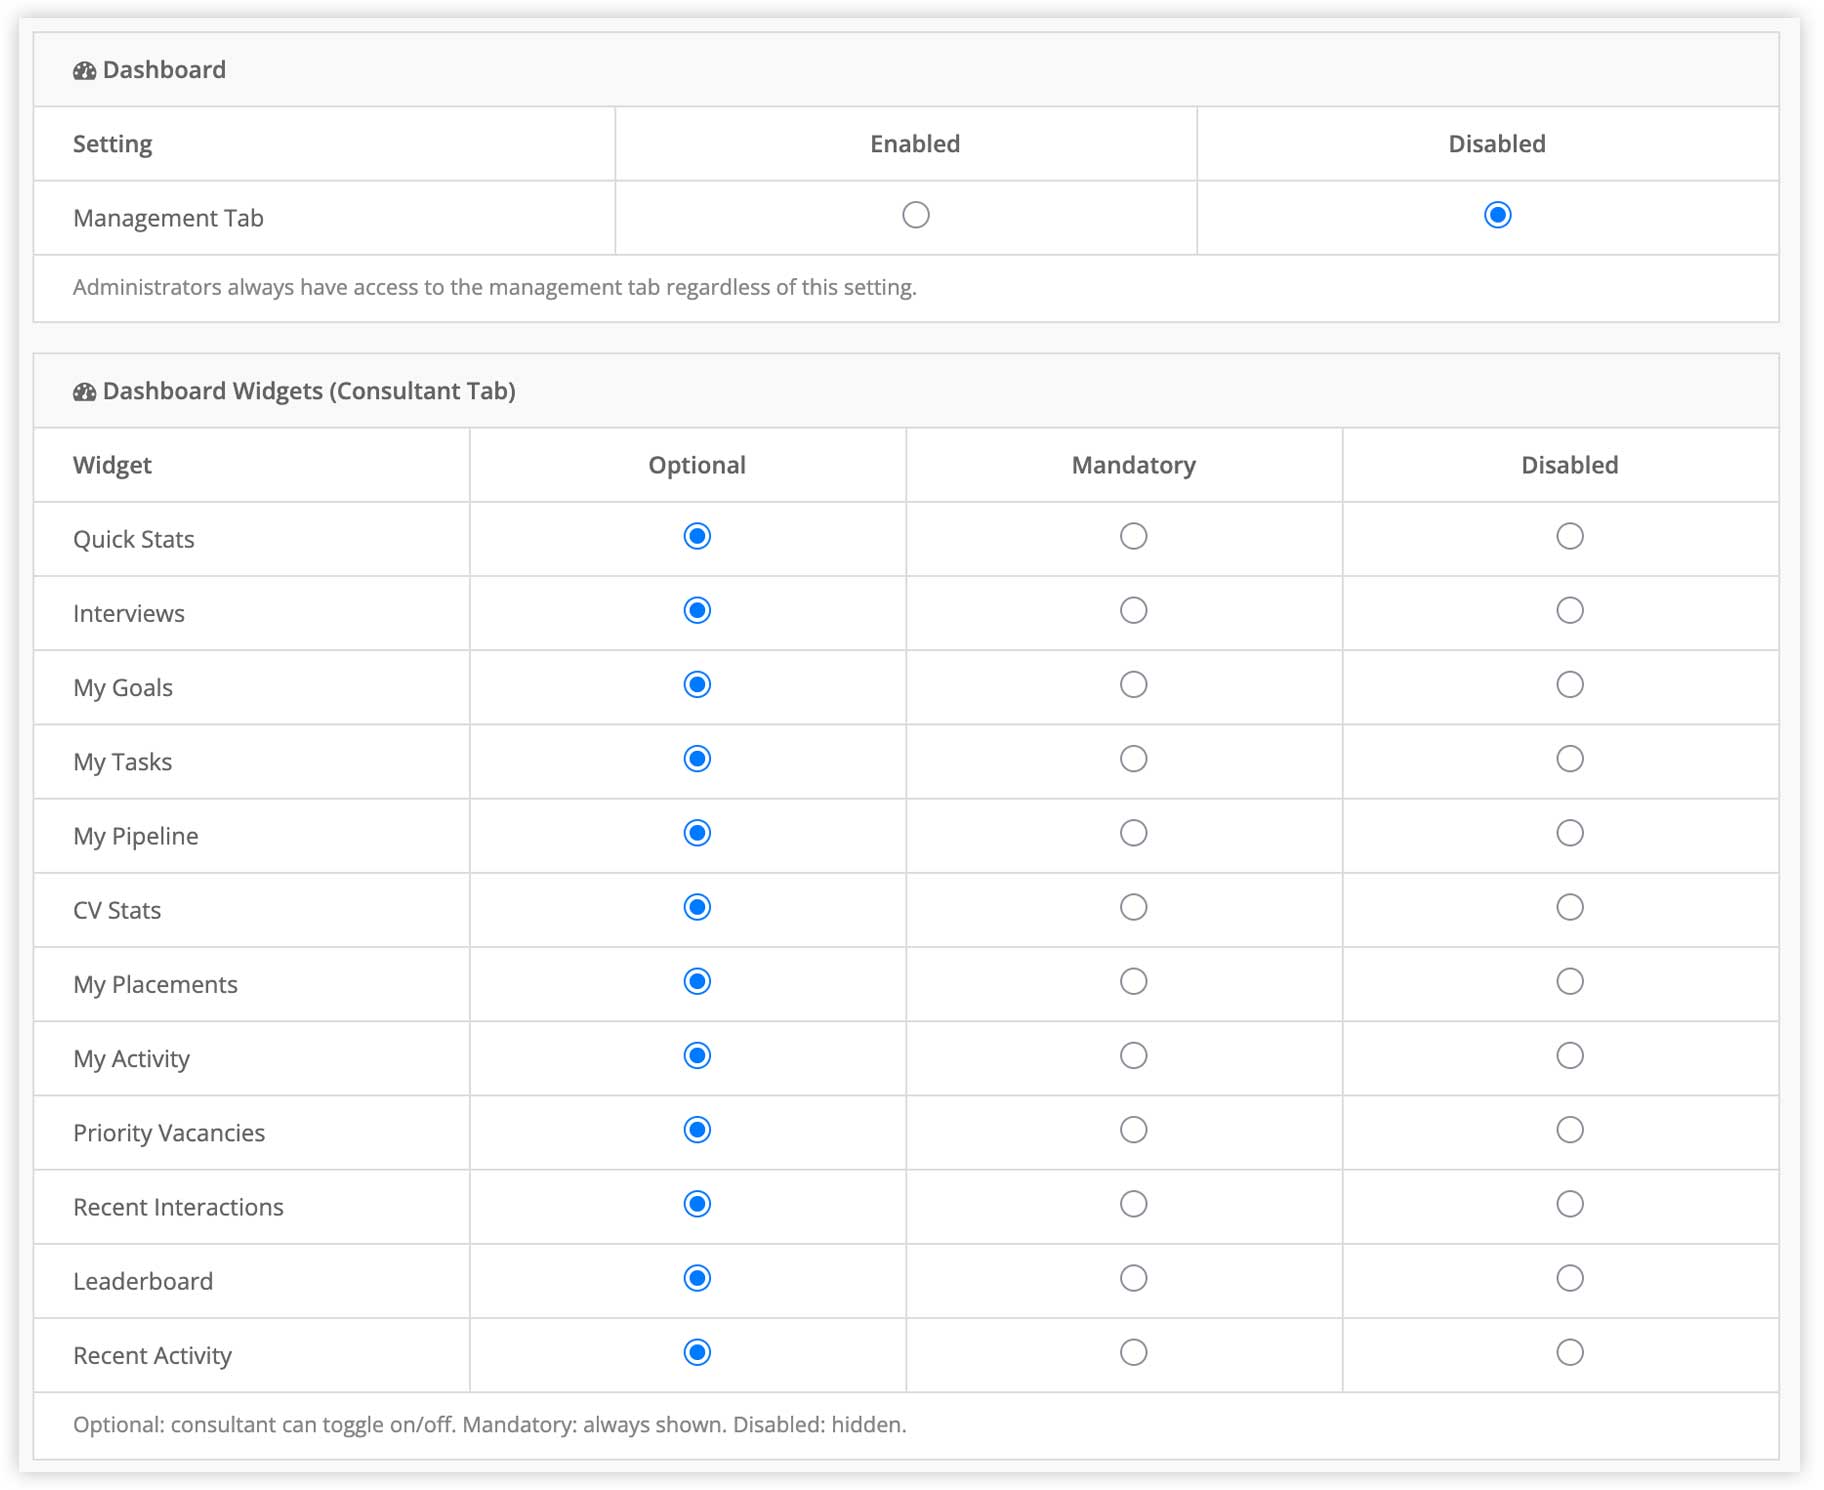
Each consultant widget has three options:
- Optional (default): Available for the consultant to enable or disable.
- Mandatory: Always shown on the consultant’s dashboard, and cannot be disabled.
- Disabled: Hidden on the consultant’s dashboard, and cannot be enabled
Notes
- These settings only affect the Consultant Tab. The Management Tab is only available to administrators and is not restricted by widget permissions.
- When a widget is set to Mandatory or Disabled, the consultant will see a badge in the Configure panel indicating that the widget cannot be changed.
- Different permission groups can have different widget settings, so you can tailor the dashboard experience for different roles.